


Overview
It is useful to break down a project into its most basic parts, which we call pipeline and components.
-
A pipeline refers to the steps that are necessary to build a project (e.g., prepare dataset, run model, produce tables and figures), and
-
Components refer to a project’s most nuclear building blocks (e.g., data, source code, and generated temporary and/or output files).
Later on, you will see that such a structure enables you to work on your project using multiple computers (e.g., your workstation, your laptop, a computer in the cloud), or with various collaborators/co-authors.
Project Pipelines
In a research project, one typically has several tasks to accomplish, such as preparing the data, analyzing the data, writing the paper and producing a set of slides.
This is what we call a “project pipeline."
A typical pipeline for an academic paper may look like this:
 Example
Typical pipeline for an academic paper
- Prepare dataset for analysis
- Run model on a dataset
- Produce tables and figures for the paper
Over time, your pipeline will grow increasingly complex. For example, the pipeline above recently “matured” into this one:
ExampleMore complex pipeline for an academic paper
- Download public datasets from the U.N. (to be used for some control variables)
- Have an RA code some auxiliary variables - files to be delivered in Excel
- Merge your primary data set with control variables from previous steps; generate to “derivative” data sets - one at the monthly level, and one at the weekly level.
- Estimate models on both data sets
- Systematically compare both models
- Choose the best model and produce tables and figures for a paper.
Of course, you can even come up with pipelines that are even more complex - not because we love complexity, but because we love clarity.
The benefits of conceiving your project like a pipeline are straightforward:
-
Write clearer source code: separate your thousand-line source code into multiple smaller, more accessible components (as defined in your pipeline, like preparing dataset, then running a model, then producing tables and figures).
-
Obtain results faster: Because your project is separated into different pipeline stages and each of these stages is self-contained, you can easily run “later” stages of your project (we call this “downstream”), based on different input files defined earlier in your project (we call this “upstream”). You can run later stages in your project (e.g., “analysis”) using different inputs (e.g., a data set at the monthly level, and at the weekly level) - that way, you can rapidly understand how robust your findings are with regard to alternative specifications.
-
Increase transparency and foster collaboration: With more transparent source code, you allow others to more easily understand your code. Also, why not make a co-author responsible for prepping that data for you (“upstream” in your pipeline), while you concentrate on developing a prototype model (more “downstream” in your pipeline)?
-
Use multiple software packages: In a pipeline, the “outputs” of one module serve as the “inputs” of another. Hence, you can use multiple software packages to accomplish different tasks in your pipeline. For example, we use R’s powerful data.table package to clean data, and pass on the cleaned dataset to a clustering algorithm in Python’s scikit-learn. In other words, we use whatever software package we deem most appropriate for each step in our pipeline.
Project Components
Now that we’ve covered what a pipeline is, let’s draw our attention to project components, which are the most nuclear building blocks of a project. It’s useful to think of these components as separate entities of your project because their nature allows you to apply different data management policies.
-
For example, we probably all agree it’s desirable to roll back to previous versions of a project (e.g., an earlier version of a prepped dataset). But - if you work on large datasets - it may probably be too burdensome to store each version of your generated files (e.g., in one of the projects we’ve been working on, the generated (cleaned) data sets were a 500 GB, and we’ve created probably close to 50 versions = 25 TB).
-
If you think about this a bit more, you may discover that storing these different data sets is completely inefficient - as the combination of raw data and versioned source code will be able to “re-cast” any data set version you have ever worked on.
Suppose you needed to bring structure to a chaotic and poorly organized project, then probably you may end up with the following project “components”:
-
raw data
These are the data sets used in the projects. Typically, you will never delete that data, but only add new data sets throughout the duration of the project.
-
source code
This is all the source code written to execute your pipeline (defined earlier; e.g., preparing data, analyzing it, and producing some tables or figures).
-
Each source code file typically…
- loads some input files or accepts some arguments,
- does some operations on data (e.g., clean it, estimate a model), and
- then saves generated files (output, audit, or temporary files).
-
It’s important to version your code, so that you can always roll back to different incarnations of your project.
-
-
generated files (temporary, output, and audit)
These files are the result of executing your source code. Think about cleaned data sets, results of your analysis, tables and figures, or some log files to audit whether everything went well (e.g., counting the number of observations, and writing those in
audit.txt). In most instances, it may be enough to store those only temporarily on your local computer. -
file exchange
File exchanges are used to easily “ping-pong” (upload or download) generated temporary or output files between different stages of the pipeline.
ExampleExamples of file exchanges
-
A file exchange to collaborate with others:
- A co-author builds a prototype model on his laptop (see stage 2 of the pipeline). He/she can work on a dataset that you have prepped using a high-performance workstation (this part of the pipeline), without having to actually build the dataset him/herself from scratch.
-
A file exchange without any collaboration:
- You have built a data set on a high-performance workstation, and would like to work with a sample dataset on your laptop, without having to actually build the dataset from scratch.
-
Situations in which a file exchange is not necessary:
- You are working exclusively on one computer, without any coauthors.
-
Curious on how to set up a file exchange? We’ll explain that later.
-
notes
You can keep your meeting notes, PDFs of the literature that you’ve read, etc. in a separate folder (with, potentially, subfolders).
Putting it all together…
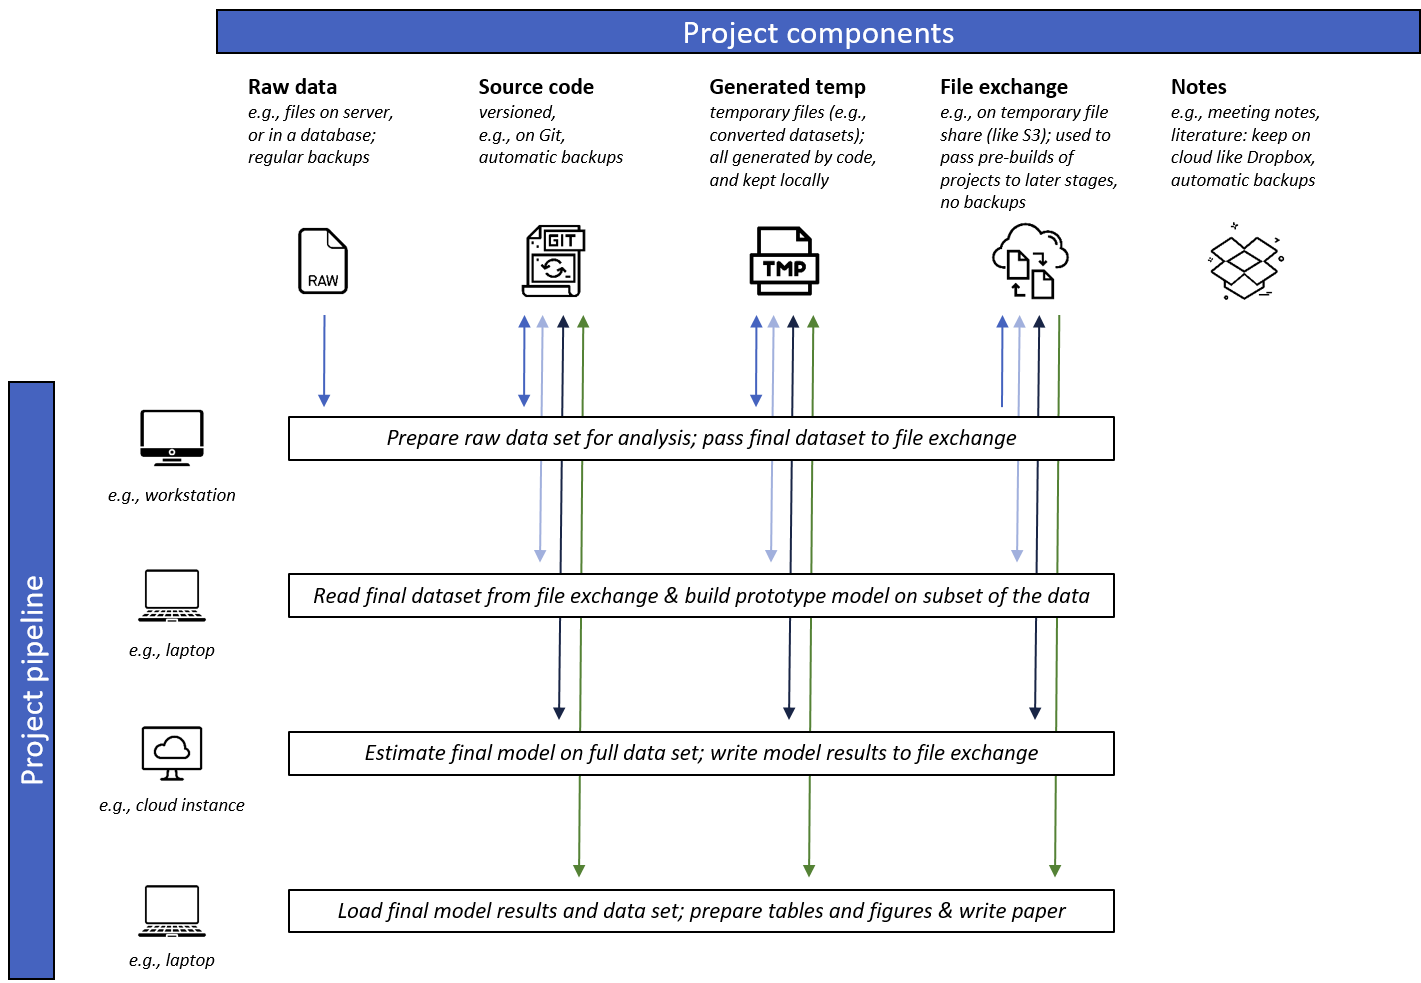
It’s time to finally build your project! See our overview chart below, which illustrates how different stages of your pipeline use different project components.
 Summary
Written explanation of the workflow
-
Stage 1 - Prepare raw data: In the first stage of the pipeline, we use a workstation with relatively large memory (e.g., 64 GB) to download the raw data from our secure server, and run some code to prepare different versions of the dataset (e.g., the final data, and dataset only 1% of the size of the full one). We version our code using Git, and upload the two final datasets to the temporary file exchange.
-
Stage 2 - build prototype model: In the second stage of the pipeline, we have switched to our laptop, and pull in only the sample data set from the file exchange. That one is only a few megabytes big, so it’s perfect to develop a prototype model and extensively test it. We pass the model results back to the file exchange so that we can already generate some tables and figures for stage 4 of the project. Of course, we’re also committing our changes to the model code to Git so that later pipeline stages can use our updated model code.
-
Stage 3 - estimate final model: It’s time to estimate our model on the entire dataset! We’ve launched a powerful EC2 instance in the Amazon Cloud, cloned our source code using Git, pulled in that big final dataset from the file exchange, and estimate our model. We’re relieved the model is running in the cloud, as that computer likely will not restart or crash.
-
Stage 4 - prepare tables and figures & write paper: Time to shine! We pull in our final data set from stage 1, and either the prototype model results (from stage 2) or the final model results (from stage 3) to produce tables (e.g., descriptive stats, model results) and figures (e.g., plotting some data) that will directly feed in our paper our slide deck.
SummaryYou’ve just learnt about two essential ways to look at a project.
- The pipeline defines the logical steps in which your project is built (such as prepping data, analyzing it, and creating tables and figures).
- The components refer to the most nuclear units in a project - consisting of raw data, source code, generated temporary/output files, a file exchange, and lastly a collection of notes/other documents.
The power of setting up your project that way lies in:
- full portability
- Because of the modular nature of the project, each pipeline can essentially be executed on different computing systems. That’s super handy if you have a powerful workstation in your office (e.g., high RAM to prep some large data sets), but would like to work on your laptop while traveling to make some progress on your model prototype.
- Your project may need large computational resources to estimate your model on your final data set - so you can easily “port” your entire infrastructure to a high-performance cluster (e.g., surfsara in Amsterdam, EC2 at Amazon Web Services, etc.).
- reproducibility and transparency
- nothing in this project is “manually edited” (e.g., deleting some observations in an Excel file) - every bit of your project is documented in source code.
- anybody interested in running your analysis can run your code (but tell them to visit our website first!) ;)
- even you will be able to understand your project better, e.g., when you continue working on it after a while, like for a revision.