Overview
In this tutorial, we will work through an overview of what mediation analysis is, it’s key principles and how to interpret the results of a mediation analysis. This article, will make use of a step-by-step example within R.
# Packages
library("DiagrammeR") # Making Causal Diagrams
library("fixest") # Run the regressions
library("modelsummary") # Providing summary tables
library("readr") # Read in the data file
What is Mediation Analysis?
Imagine I am researching the relationship between income and happiness: X (Income) → Y (Happiness). I could do a regression analysis looking at this direct relationship.

# Creating The causal diagram (I ommitted the code of similar examples)
grViz("
digraph {
  graph []
  node [shape = plaintext]
    X [label = 'Income']
    Y [label = 'Happiness']
  edge [minlen = 2]
    X->Y
  { rank = same; X; Y }
}
")
However, upon closer examination, do you believe that money alone guarantees happiness?
Let’s hypothesize that higher income enables enjoyable spending, which, in turn, boosts happiness:
X (Income) → M (Enjoyable Spending) → Y (Happiness).
This is a classic case of mediation analysis.

Mediation analysis is a statistical method that examines the “how” and “why” behind observed relationships.
It is used in economics, psychology, and other fields. It explores how independent variables (the X’s) influences the dependent variable (Y) through an intermediary: a mediator (M).
In essence, mediation analysis helps us understand the mechanisms at work that explain the relationship between variables. Furthermore, we can estimate how much a mediator mattered, by attributing part of the treatment effect to a mediator.

The Basics
Mediation analysis operates under the assumption of temporal precedence, meaning that it assumes changes in the treatment occurs before changes in the mediator, and changes in the mediator occur before changes in the outcome.
Mediation analysis differentiates between the total effect of a treatment variable (X) on an outcome (Y) into a direct and indirect effect through a mediator (M).
Total effect = Direct effect + Indirect effect
The process involves three key regression equations:
1. Total Effect: X → Y

Regression equation (1):
\(Y = \beta_0 + \beta_1 X + \epsilon\)The significance of this relationship ($\beta_1$) indicates if X affects Y. if it doesn’t, and there is no strong theoretical backing, mediation is usually not explored further, as there is nothing to be investigated.
2. First Part Indirect Effect: X → M

Regression equation (2):
\(M = \beta_0 + \beta_2 X + \epsilon\)This equation examines the first part of the indirect effect, establishing whether X impacts the mediator M. The significance of this relationship ($\beta_2$) indicates if X affects M. If X and M have no correlation, further research is not necessary. A mediation is only meaningful if X affects M.
3. Second Part Indirect Effect and Direct Effect: X + M → Y

Regression equation:
\(Y = \beta_0 + \beta_4 X + \beta_3 M + \epsilon\)$\beta_3$ assesses the total indirect effect.
The direct effect can be defined as the change we would see in the outcome due to a change in the treatment variable if we keep the mediator variable constant. If the effect of X on Y, $\beta_4$, is non-significant or smaller than before $\beta_1$, then it suggests that M mediates the relationship of X and Y.
If the effect of X on Y completely disappears $\beta_4 = 0$, then M fully mediates between X and Y (full mediation). If the effect of X on Y still exists, but in a smaller magnitude, M partially mediates between X and Y (partial mediation).
Thus, If a mediation effect exists, the effect of X on Y will disappear (or at least weaken) when M is included in the regression.
The relative size of the mediated effect can be assessed using the proportion mediated, which represents the size of the indirect effect estimated relative to the total effect estimated.
To validate a mediation effect, a Sobel Test runs two regressions:
- How does the independent variable X influences the mediator M,
- Assess how X and M affect the dependent variable Y. The test then compares these results to determine if the mediation effect is statistically significant.
Step by Step Example
In this part of the tutorial, we’ll explore the relationship between the increase in refrigerator ownership from 1940 to 1950 and women entering the workforce. Specifically, we want to understand how much of this rise in appliance adoption is due to an increase in household income. It will be a replication of the following study.

The variables used in the tutorial:
- mech_fridge: Refrigator ownership (Y)
- LFP: Women’s labor force participation (T)
- ihs_hhinc: household income (M)
- fac_highcas_y1950: wartime factory in a high casualty county (IV)
# Loading in the Dataset
data <- read_csv("~/Desktop/TSH/Tilburg Science Hub/Content/Development_Calls/Tutorial Mediation Analysis/Data/Replication Package/Replication code/Tutorial_Mediation_Analysis")

# Setting up Modelsummary
gm <- list(
  list("raw" = "nobs", "clean" = "Sample size", "fmt" = 0),
  list("raw" = "r.squared", "clean" = "R<sup>2</sup>", "fmt" = 2),
  list("raw" = "adj.r.squared", "clean" = "Adjusted R<sup>2</sup>", "fmt" = 2))
notes <- c('*** = .01', '* = .1', '** = .05')
Stage 1: Total Effect Analysis

# Here the code for the full Causal Diagram
grViz("
digraph {
  graph []
  node [shape = plaintext]
    X [label ='Women Labour Force Participation', shape = box, color = red]
    Y [label ='Refrigerator Ownership', shape = box, color = red]
    M [label ='Household Income', shape = box]
    IV [label ='Wartime Casualties', shape = box]
  edge [minlen = 2]
    IV->X
    X->M
    M->Y
    X->Y [color = red]
  { rank = same; X; Y; M }
}
")
Step 1 in conducting a mediation analysis involves measuring the total effect.
This initial measurement helps determine if there is a subject worth researching.
In our example, the total effect is calculated using the following formula:
\(\small \text{Refrigerator Ownership} = \beta_0 + \beta_1 \text{Women Labour Force Participation} + \epsilon\)
In replicating the analysis for this tutorial, it’s crucial to note that the authors of our example used an Instrumental Variable (IV) approach, which adds a layer of complexity to the regression analysis. Let’s break down the steps to understand this better.
 Tip
TipFor an introduction to an instrumental variable regression, look at this article.
Our chosen instrumental variable for women’s labor force participation is the presence of a wartime factory in counties with high wartime casualties.To implement the IV approach, we first run a “first-stage” regression, represented by the following formula:
\(\small \text{Women Labour Force Participation} = \alpha_0 + \alpha_1 \text{Wartime Casualties} + \epsilon\)
Following the first-stage regression, we use its fitted values as the variables for Women Labour Force Participation in the main regression equation. Our example also incorporates fixed effects, particularly at the county level. Instead of using separate regressions for each stage, we opt for the feols function rather than the function ivreg.
In the code snippet below, the regression is specified to include control variables, fixed effects, and the first-stage regression.
# Regression
reg_1 = feols(mech_fridge ~ year + rugged_mean_y1950 + x_centroid_y1950 +
                 y_centroid_y1950 + pc_neg1940_y1950 + pc_farm1940_y1950 +
                 pctdwown_1940_y1950 + avg_edu1940_y1950
                 | fips # Fixed Effects
                 | LFP ~ fac_highcas_y1950, data) #IV Regression (First stage)

# Model Output
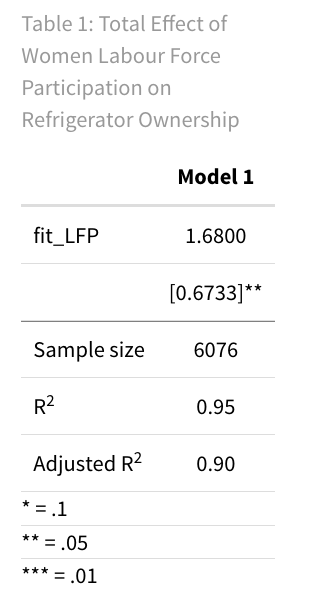
titlereg_1 <- 'Table 1: Total Effect of Women Labour Force Participation on Refrigerator Ownership'
msummary(reg_1,
         vcov = ~fips,
         fmt = 4,
         stars  = c('*' = .1,
                    '**' = 0.05,
                    '***' = .01),
         estimate = "{estimate}",
         statistic = "[{std.error}]{stars}",
         coef_omit = 'year|rugged_mean_y1950|x_centroid_y1950|y_centroid_y1950|pc_neg1940_y1950|pc_farm1940_y1950|pctdwown_1940_y1950|avg_edu1940_y1950',
         gof_omit = 'AIC|BIC|RMSE|Within|FE',
         gof_map = gm,
         title = titlereg_1,
         notes = notes)

The summary table shows that the total effect, represented by $\beta_1$ = 1.68, is statistically significant. This indicates that Women Labour Force Participation has a significant impact on Refrigerator Ownership.
 Tip
TipThe regression results are presented using the modelsummary package. For a detailed explanation, refer to this article.
Stage 2: First Part Indirect Effect (Temporal Precedence)

The second step in a mediation analysis is centered on quantifying the effect of the treatment variable (X) on the proposed mediator (M). In our example, we evaluate the first part of the indirect effect using the following equation:
\( \small \text{Household Income} = \beta_0 + \beta_2 \text{Women Labour Force Participation} +\epsilon\)
To implement the IV approach, we first run again the same “first-stage” regression, represented by the following formula:
\( \small \text{Women Labour Force Participation} = \alpha_0 + \alpha_1 \text{Wartime Casualties} + \epsilon\)# Regression
reg_2 = feols(ihs_hhinc ~ year + rugged_mean_y1950 + x_centroid_y1950 +
y_centroid_y1950 + pc_neg1940_y1950 + pc_farm1940_y1950 +
pctdwown_1940_y1950 + avg_edu1940_y1950
| fips
| LFP ~ fac_highcas_y1950, data)
# Model Output
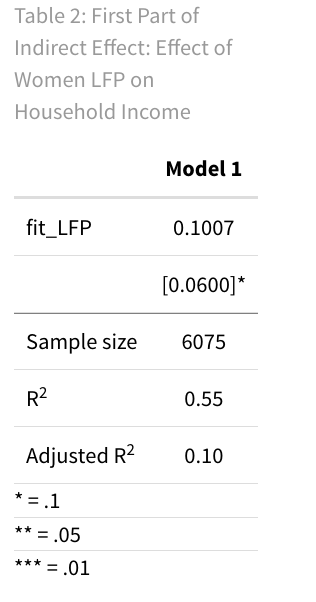
titlereg_2 <- 'Table 2: First Part of Indirect Effect: Effect of Women LFP on Household Income '
msummary(reg_2,
vcov = ~fips,
fmt = 4,
stars = c('*' = .1,
'**' = 0.05,
'***' = .01),
estimate = "{estimate}",
statistic = "[{std.error}]{stars}",
coef_omit = 'year|rugged_mean_y1950|x_centroid_y1950|y_centroid_y1950|pc_neg1940_y1950|pc_farm1940_y1950|pctdwown_1940_y1950|avg_edu1940_y1950',
gof_omit = 'AIC|BIC|RMSE|Within|FE',
gof_map = gm,
title = titlereg_2,
notes = notes)

The regression output indicates a significant indirect effect of 0.1007 ($\beta_2$), suggesting that Women Labour Force Participation significantly influences Household Income. This validates that the treatment variable has a meaningful impact on the proposed mediator.
Stage 3: Direct Effect & Second Part Indirect Effect

The third step in a mediation analysis is designed to quantify both the impact of the mediator variable (M) on the outcome (Y) and the total direct effect of the treatment variable on the outcome. This step allows us to measure the second component of the indirect effect.
In our example, this is represented by the following formula:
To implement the IV approach, we again perform a “first-stage” regression. However, this time the formula is slightly adjusted to account for both the instrumental variable and the treatment variable.
# Regression
reg_3 = feols(mech_fridge ~ LFP +  year + rugged_mean_y1950 + x_centroid_y1950 +
                 y_centroid_y1950 + pc_neg1940_y1950 + pc_farm1940_y1950 +
                 pctdwown_1940_y1950 + avg_edu1940_y1950
                 | fips
                 | ihs_hhinc ~ fac_highcas_y1950 + LFP, fridge)

# Model Output
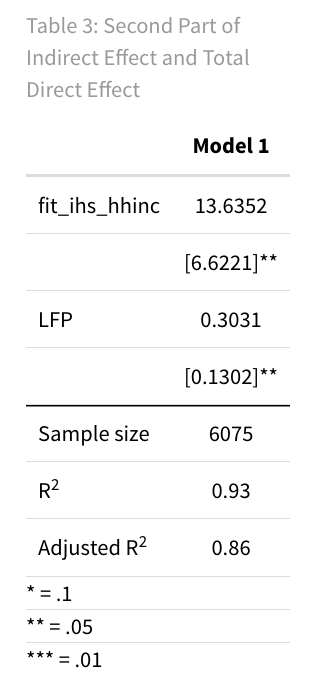
titlereg_3 <- 'Table 3: Second Part of Indirect Effect and Total Direct Effect'
msummary(reg_3,
         vcov = ~fips,
         fmt = 4,
         stars  = c('*' = .1,
                    '**' = 0.05,
                    '***' = .01),
         estimate = "{estimate}",
         statistic = "[{std.error}]{stars}",
         coef_omit = 'year|rugged_mean_y1950|x_centroid_y1950|y_centroid_y1950|pc_neg1940_y1950|pc_farm1940_y1950|pctdwown_1940_y1950|avg_edu1940_y1950',
         gof_omit = 'AIC|BIC|RMSE|Within|FE',
         gof_map = gm,
         title = titlereg_3,
         notes = notes)

Based on the calculated values, we can make several conclusions about the mediation effect:
- The total direct effect $\beta_4$ = 0.3031, which is significant and smaller than the total effect $\beta_1$ = 1.68, this suggests that Household Income (M) partially mediates the relationship between Women Labour Force Participation (X) and Refrigerator Ownership (Y).
- The value of the second part of the indirect effect is $\beta_3$ = 13.6352.
- The total indirect effect can be calculated as $\beta_2$ * $\beta_3$ = 0.1008 * 13.6352 = 1.375.
Note: Total effect = Direct effect + Indirect effect = $\beta_1 = \beta_2 * \beta_3 + \beta_4$ = 1.68 = 0.101 * 13.635 + 0.303
Interpretation of Results
Proportion Test
In summary, when conducting a mediation analysis, calculating the proportion of the total treatment effect that is mediated can provide valuable insights. In our example, the 81.90% mediated effect underscores the importance of Household Income in linking Women Labour Force Participation to Refrigerator Ownership. Understanding this percentage helps to quantify the role of the mediator. The following formula can be used:
\( \small \frac{\text{Indirect effect}}{\text{Total effect}} * 100 = \frac{\beta_2 * \beta_3}{\beta_1} * 100 = 81.90\)
Statistical Significance Test
To check if the mediation effect is statistically significant and not only relevant as is showcased in the proportion test, the Sobel Test is often conducted. This test helps determine if the mediator, like Household Income in our example, significantly affects the relationship between the independent variable (Women Labour Force Participation) and the dependent variable (Refrigerator Ownership). In simpler terms, it tells us if the mediation effect is real or just random. Using the Sobel Test makes us more confident about Household Income’s role as a mediator.
 Example
To conduct a Sobel test in R, we will use the bda package. The follwowing syntax is used to conduct a sobel test:
mediation.test(mv,iv,dv)
- mv is the mediator variable,
- iv is the independent variable,
- dv is the dependent variable.

 Tip
TipBootstrapping
Recent research has used Bootstrapping over the Sobel Test when assessing the statistical significance of a mediation effect. Bootstrapping has several advantages over the Sobel Test when assessing mediation effects:
- Non-Normality: Bootstrapping doesn’t assume that the sampling distribution of the indirect effect is normally distributed.
- Power: Bootstrapping often has higher statistical power, increasing the likelihood of detecting a mediation effect when one exists.
- Confidence Intervals: Bootstrapping provides confidence intervals for the indirect effect, offering a range of plausible values rather than just a point estimate.
- Complex Models: Bootstrapping can be easily extended to more complex mediation models, including multiple mediators or moderated mediation, which may be challenging for the Sobel Test.
- Small Samples: Bootstrapping can be more reliable than the Sobel Test in small sample sizes, though care should still be taken in such cases.
In R, use the mediate() function from the mediation package for bootstrapping. This function needs two regression models: the first model explains the mediator variable by the treatment variable (X → M), and the second includes both the treatment and mediator variables to explain the dependent variable (X + M → Y). For bootstrapping, set boot = TRUE and sims to at least 500. After running, check the ACME (Average Causal Mediation Effects) in the results to see if it’s different from zero.
Note that this package is not compatible with the feols() function.
Here’s a stylized example:
library(mediation)
mediator_model <- lm(ihs_hhinc ~ LFP, data)
outcome_model <- lm(mech_fridge ~ LFP + ihs_hhinc, data)
results <- mediate(mediator_model, outcome_model, treat= 'LFP', mediator= 'ihs_hhinc' ,boot=TRUE, sims=500)
summary(results)

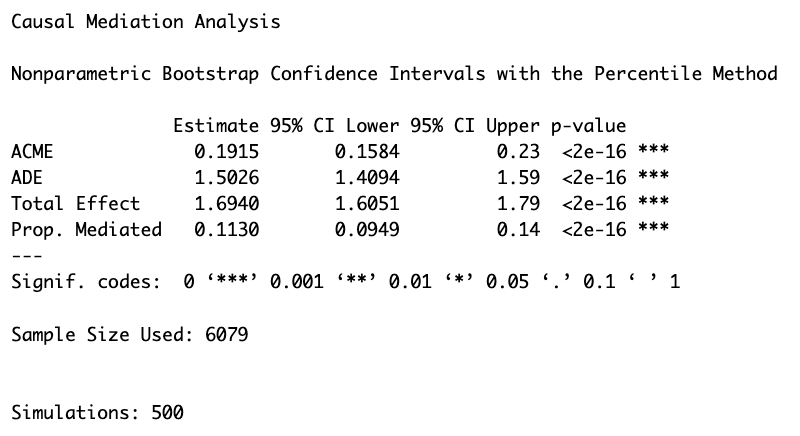
In this mediation analysis, three key effects are assessed: the total effect of X on Y, the direct effect (ADE), and the indirect or mediation effect (ACME).
- The total effect of X on Y without considering M was 1.6940.
- The direct effect of X on Y, accounting for M, was 1.5026. The Mediation Effect (ACME) measures how much of X’s influence on Y goes through M. It’s calculated as the total effect minus the direct effect (1.6940 - 1.5026 = 0.1915). Importantly, this mediation effect was found to be statistically significant.
 Summary
Mediation analysisis a statistical method used to understand how an independent variable influences a dependent variable through an intermediary variable, known as amediator, thereby revealing themechanismsunderlying observed relationships.- Basic Principles: Mediation assumes ‘
temporal precedence,’ meaning the treatment affects the mediator, which in turn affects the outcome. The total effect of the treatment on the outcome is broken down into direct and indirect effects. - Key Regression Equations: Three regression equations are essential when performing a
mediation analysis:-
- Total Effect: $Y = \beta_0 + \beta_1 X + \epsilon$
-
- Indirect Effect (1): $M = \beta_0 + \beta_2 X + \epsilon$
-
- Indirect Effect (2) + Direct Effect: $Y = \beta_0 + \beta_4 X + \beta_3 M + \epsilon$
-
- Significance & Magnitude: The
Sobel testis commonly used to validate the significance of a mediation effect, however, recent research usesbootstrapping. Themagnitudecan be tested using a proportion test.
This tutorial provides an outline of mediation analysis, its key components, and its application using an example.


