Find marginal effects in R and Stata
Loading the data and setting up the models
In many cases, when analyzing a model, for example, one with a binary dependent variable, we are interested in the marginal effects of the regressors on the outcome variable rather than the headline estimated coefficients. Consider the case examined in Wooldridge’s Introductory Econometrics textbook, where a variable such as female labor participation is analyzed as depending on education, partner’s income, age, and number of children. When studying the behavior of binary variables -variables that take a value of 0 or 1- it is standard to use probit or logit models.
In such models, the probability of $y$ being equal to one is modeled as a function of regressors $x$: $P(y=1|x) = F(x\beta)$. Depending on the assumptions made on the error term we get a probit or logit model.
-
Probit. Error term is assumed to have a normal distribution. $P(y=1|x) = \Phi(x\beta)$. Where $\Phi()$ is the cummulative distribution function of a standard normal.
-
Logit. Error term is assumed to have a logistic distribution. $P(y=1|x) = \frac{exp(x\beta)}{1+exp(x\beta)}$.
# Load necessary packages
#install.packages("margins")
library(foreign)
library(margins)

# Open the dataset
datab = read.dta("http://fmwww.bc.edu/ec-p/data/wooldridge/mroz.dta")

# Run Probit and Logit Model. OLS as well, for reference

probit_model = glm(inlf ~ nwifeinc + educ + exper + age + kidslt6 + kidsge6,data=datab, family = binomial(link = "probit"))

logit_model = glm(inlf ~ nwifeinc + educ + exper + age + kidslt6 + kidsge6,data=datab, family = binomial(link = "logit"))

ols_model = lm(inlf ~ nwifeinc + educ + exper + age + kidslt6 + kidsge6,data=datab)
-Stata-
* Open the dataset
use http://fmwww.bc.edu/ec-p/data/wooldridge/mroz, clear

probit inlf nwifeinc educ exper age kidslt6 kidsge6
estimates store probit_model

logit inlf nwifeinc educ exper age kidslt6 kidsge6
estimates store logit_model
 Tip
TipConsider an outcome $a$, the marginal effect is the change of $a$ when $x$ changes: $\dfrac{\partial a}{\partial x}$. In the context of a binary model, we are generally interested in how the probability of $y$ being equal to 1 changes when a regressor $x_j$ changes:
\(\dfrac{\partial P(y=1|x_1,\dots,x_j,\dots,x_k)}{\partial x_j}\)In the case of a logit model, this can be obtained as:
$$\dfrac{\partial P(y=1|x_1,\dots,x_j,\dots,x_k)}{\partial x_j} = \beta_k \times P(y=1|x) \times (1 - P(y=1|x))$$
Which depends on the specific values not only $x_j$ but every other regressor! That is, the marginal effect of a change in a regressor on the probability of $y$ being $1$ varies for different values of the regressors. A similar result is found for a probit model.
Calculating the Average Marginal Effect (AME)
In either model, the estimated effect of the explanatory variables on the outcome variable (i.e., the increase or decrease in the probability of being in the labor force) is not constant but depends on the specific values of the explanatory variables. One standard way to report marginal effects in this situation is to calculate the Average Marginal Effect (AME), that is, computing the marginal effect at the regressors value for each observation and then averaging out for the whole sample. One can compute AMEs as follows:
# AME is the default option for the margins package in R

probit_AME = margins(probit_model)
logit_AME = margins(logit_model)

# To obtain a table reporting the values use:
summary(probit_AME)
# or equivalently
margins_summary(probit_model)
-Stata-
* To refer to the models above use estimates restore
* alternatively, you could run the probit or logit models again
* and then the margins postestimation command

estimates restore probit_model
margins, dydx(*)

estimates restore logit_model
margins, dydx(*)
| Variable | Probit AME | Logit AME |
|---|---|---|
| age | -0.0169 | -0.0165 |
| educ | 0.0408 | 0.0411 |
| exper | 0.0214 | 0.0216 |
| kidsge6 | 0.0105 | 0.0105 |
| kidslt6 | -0.2670 | -0.2608 |
| nwifeinc | -0.0035 | -0.0036 |
Marginal Effect at different values of the regressors
Alternatively, marginal effects can also be reported at given values of the regressors, which are of particular interest. For example, calculating the marginal effect of each variable for a women with 12 years of education and one children under age 6. A common report is the Marginal Effect at the Mean (MEM) gives the marginal effects at the mean values for all regressors.
 Warning
Analyzing the effect at the mean is not always desirable:
- If an explanatory variable has very skewed values, the average can be unrepresentative of the whole sample.
- If the explanatory variable is in itself binary, for example, a dummy detailing if there are any children in the household, it is not easy to interpret what the marginal effect at the mean represents.
# To obtain the marginal effects at 12 years of education and one children under age 6

margins(probit_model,at = list(kidslt6 = 1, educ = 12))

# To calculate the Marginal Effect at the Mean (MEM) we have to obtain the mean values for each variable

data_means_list = lapply(datab,mean,na.rm=T)

margins(probit_model,at = data_means_list)

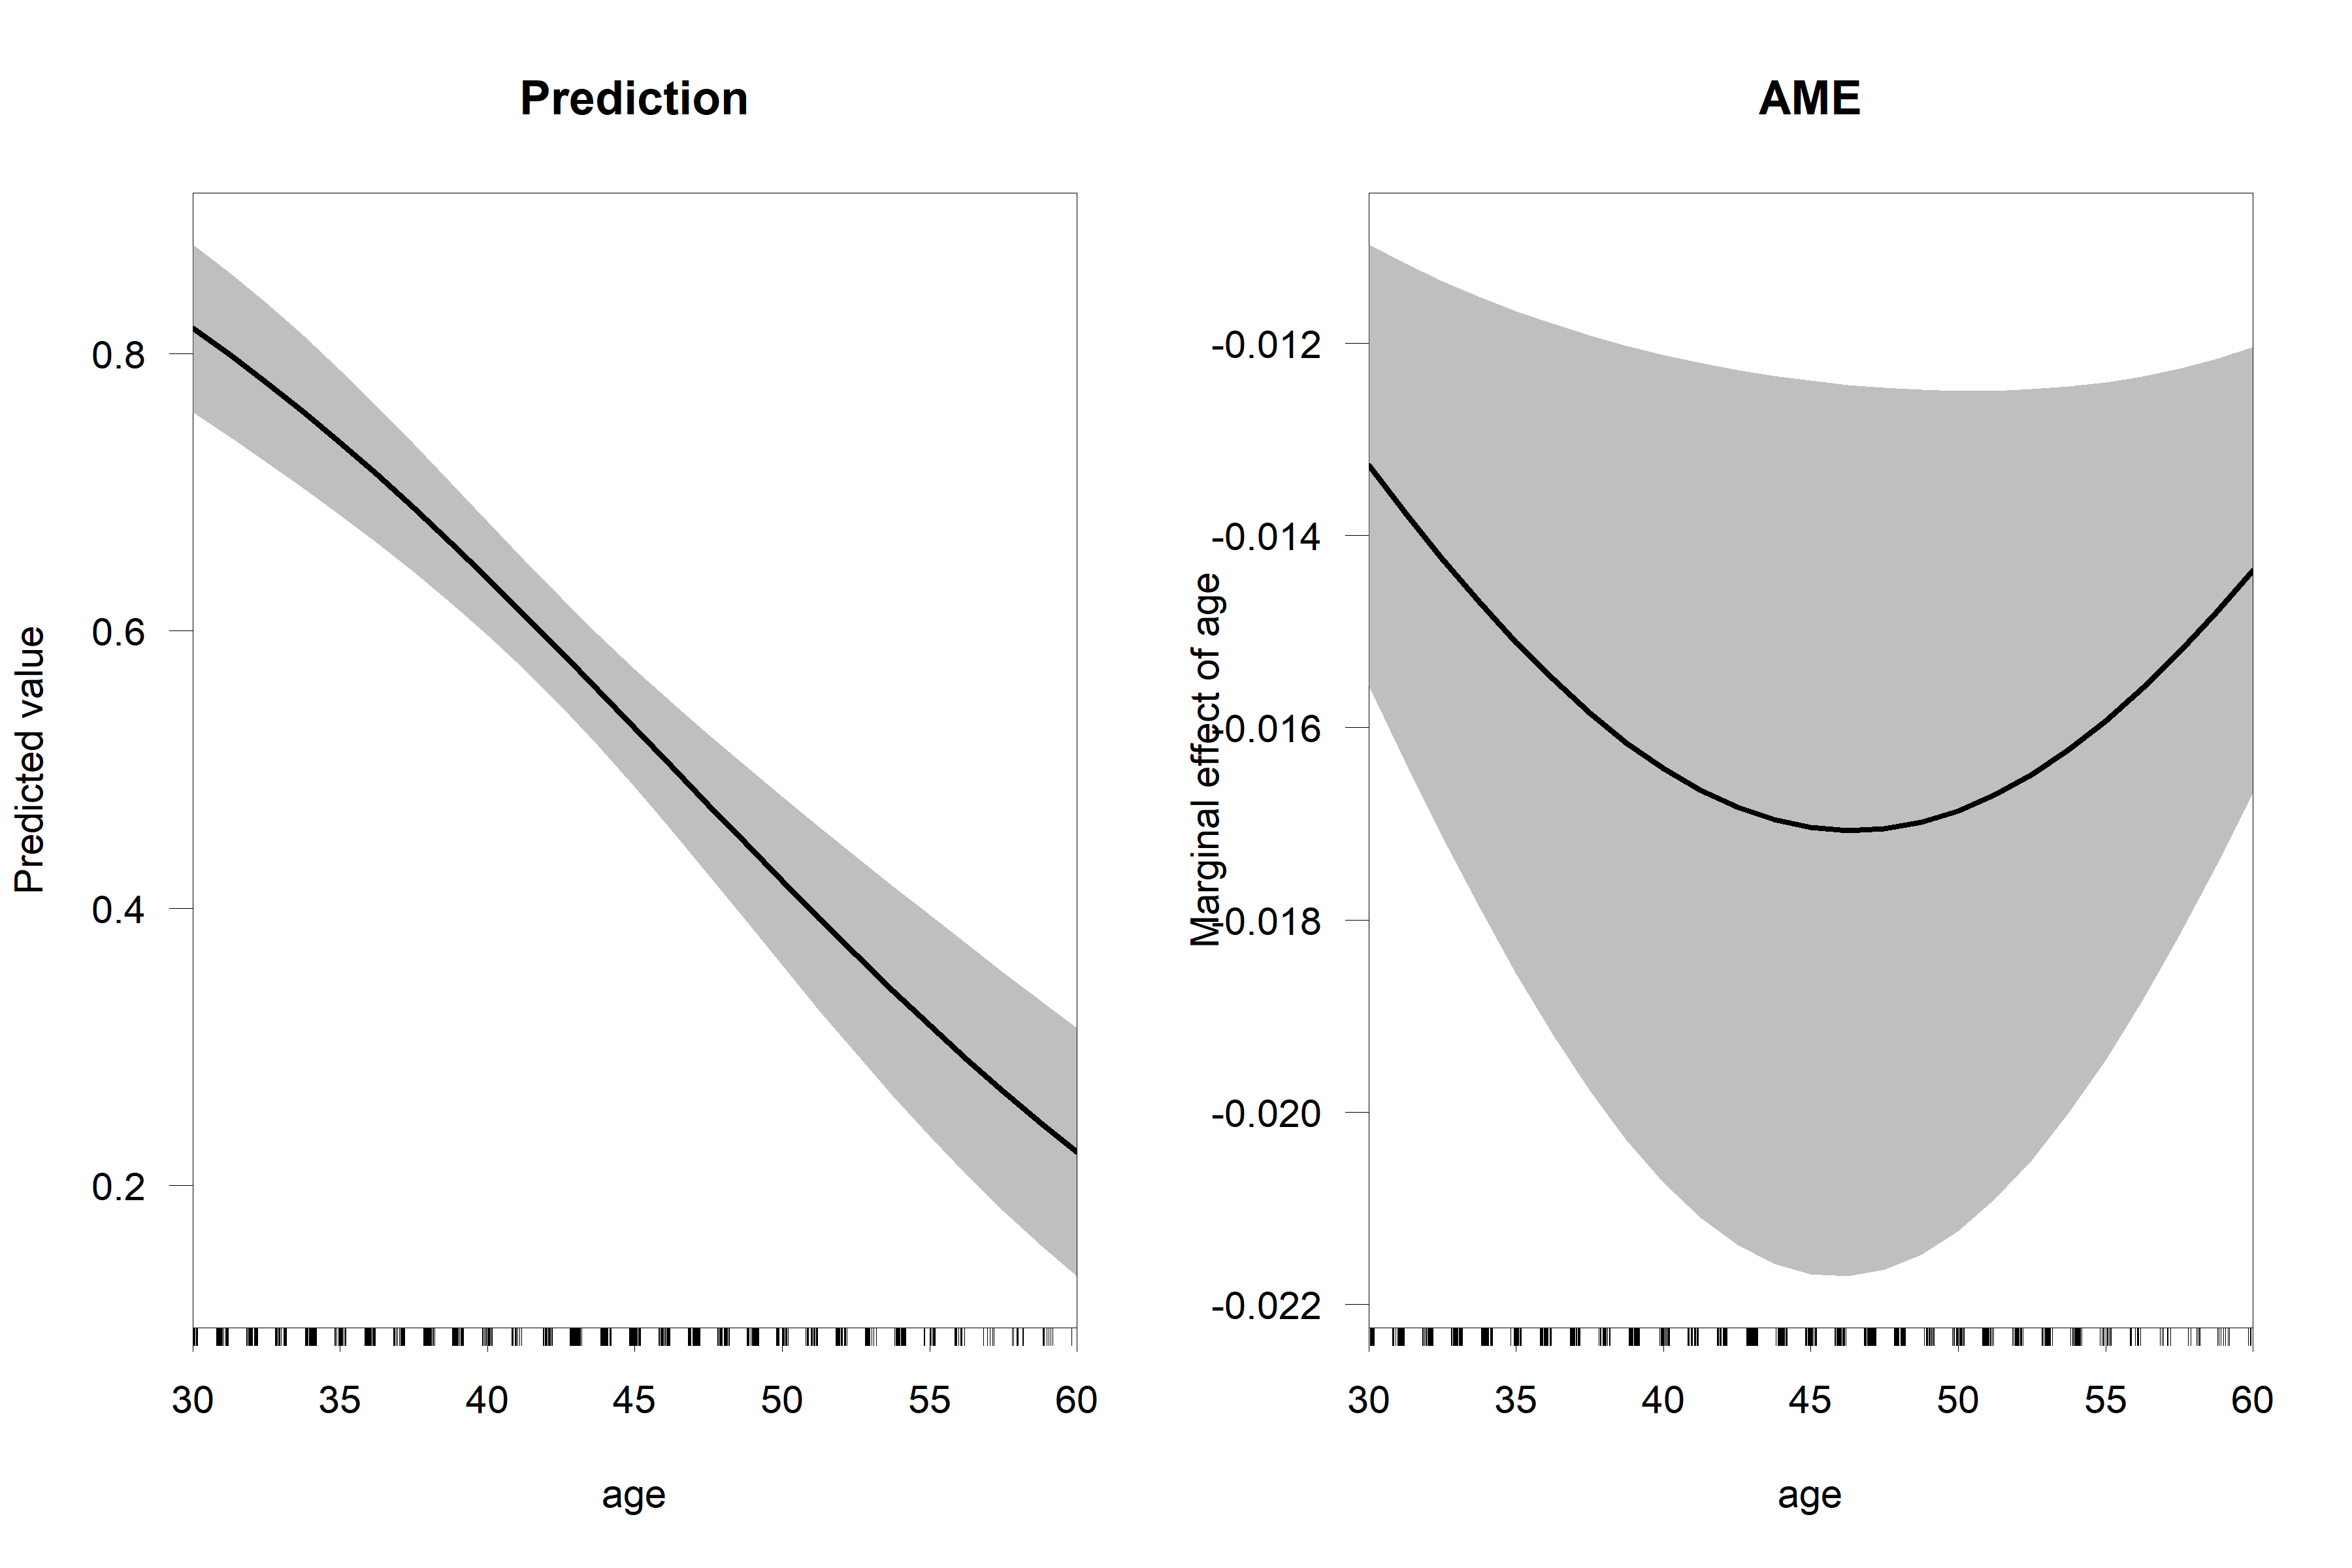
# Plot the expected probability and marginal effect for different values of age

par(mfcol=c(1,2))
cplot(object=probit_model,x="age",what="prediction",main = "Prediction")
cplot(object=probit_model,x="age",what="effect",main = "AME")
-Stata-

* To obtain the marginal effects at 12 years of education and one children under age 6

estimates restore probit_model
margins, dydx(*) at(kidslt6=1 educ=12)

* Marginal Effect at the Mean (MEM)

margins, dydx(*) atmeans

* Plot the expected probability and marginal effect for different values of age

estimates restore probit_model

margins, at(age=(30(1)60))
marginsplot, saving(age_probability)

margins,dydx(age) at(age=(30(1)60))
marginsplot, saving(age_margins)

graph combine age_probability.gph age_margins.gph
Expected probability and marginal effect for different values of age

Example with regressor squared
Take the example above but suppose we want to allow experience to enter the model both with a linear and quadratic term, since we expect a more complex relation between experience and labor market participation. Now, the probability of being in the labor market depends on both experience and experience squared. Take the case of the logit model:
$$P(y=1|x) = \frac{exp(\text{experience}\times \beta_1 + \text{experience}^2\times\beta_2 + \text{age}\times\beta_3 + \dots)}{1 + exp(\text{experience}\times \beta_1 + \text{experience}^2\times\beta_2 + \text{age}\times\beta_3 + \dots)}$$
Then, the marginal effect with respect to experience will be:
$$\dfrac{\partial P(y=1|x)}{\partial \text{experience}} = (\beta_1 + \text{experience} 2\times\beta_2)\times P(y=1|x) \times (1 - P(y=1|x))$$
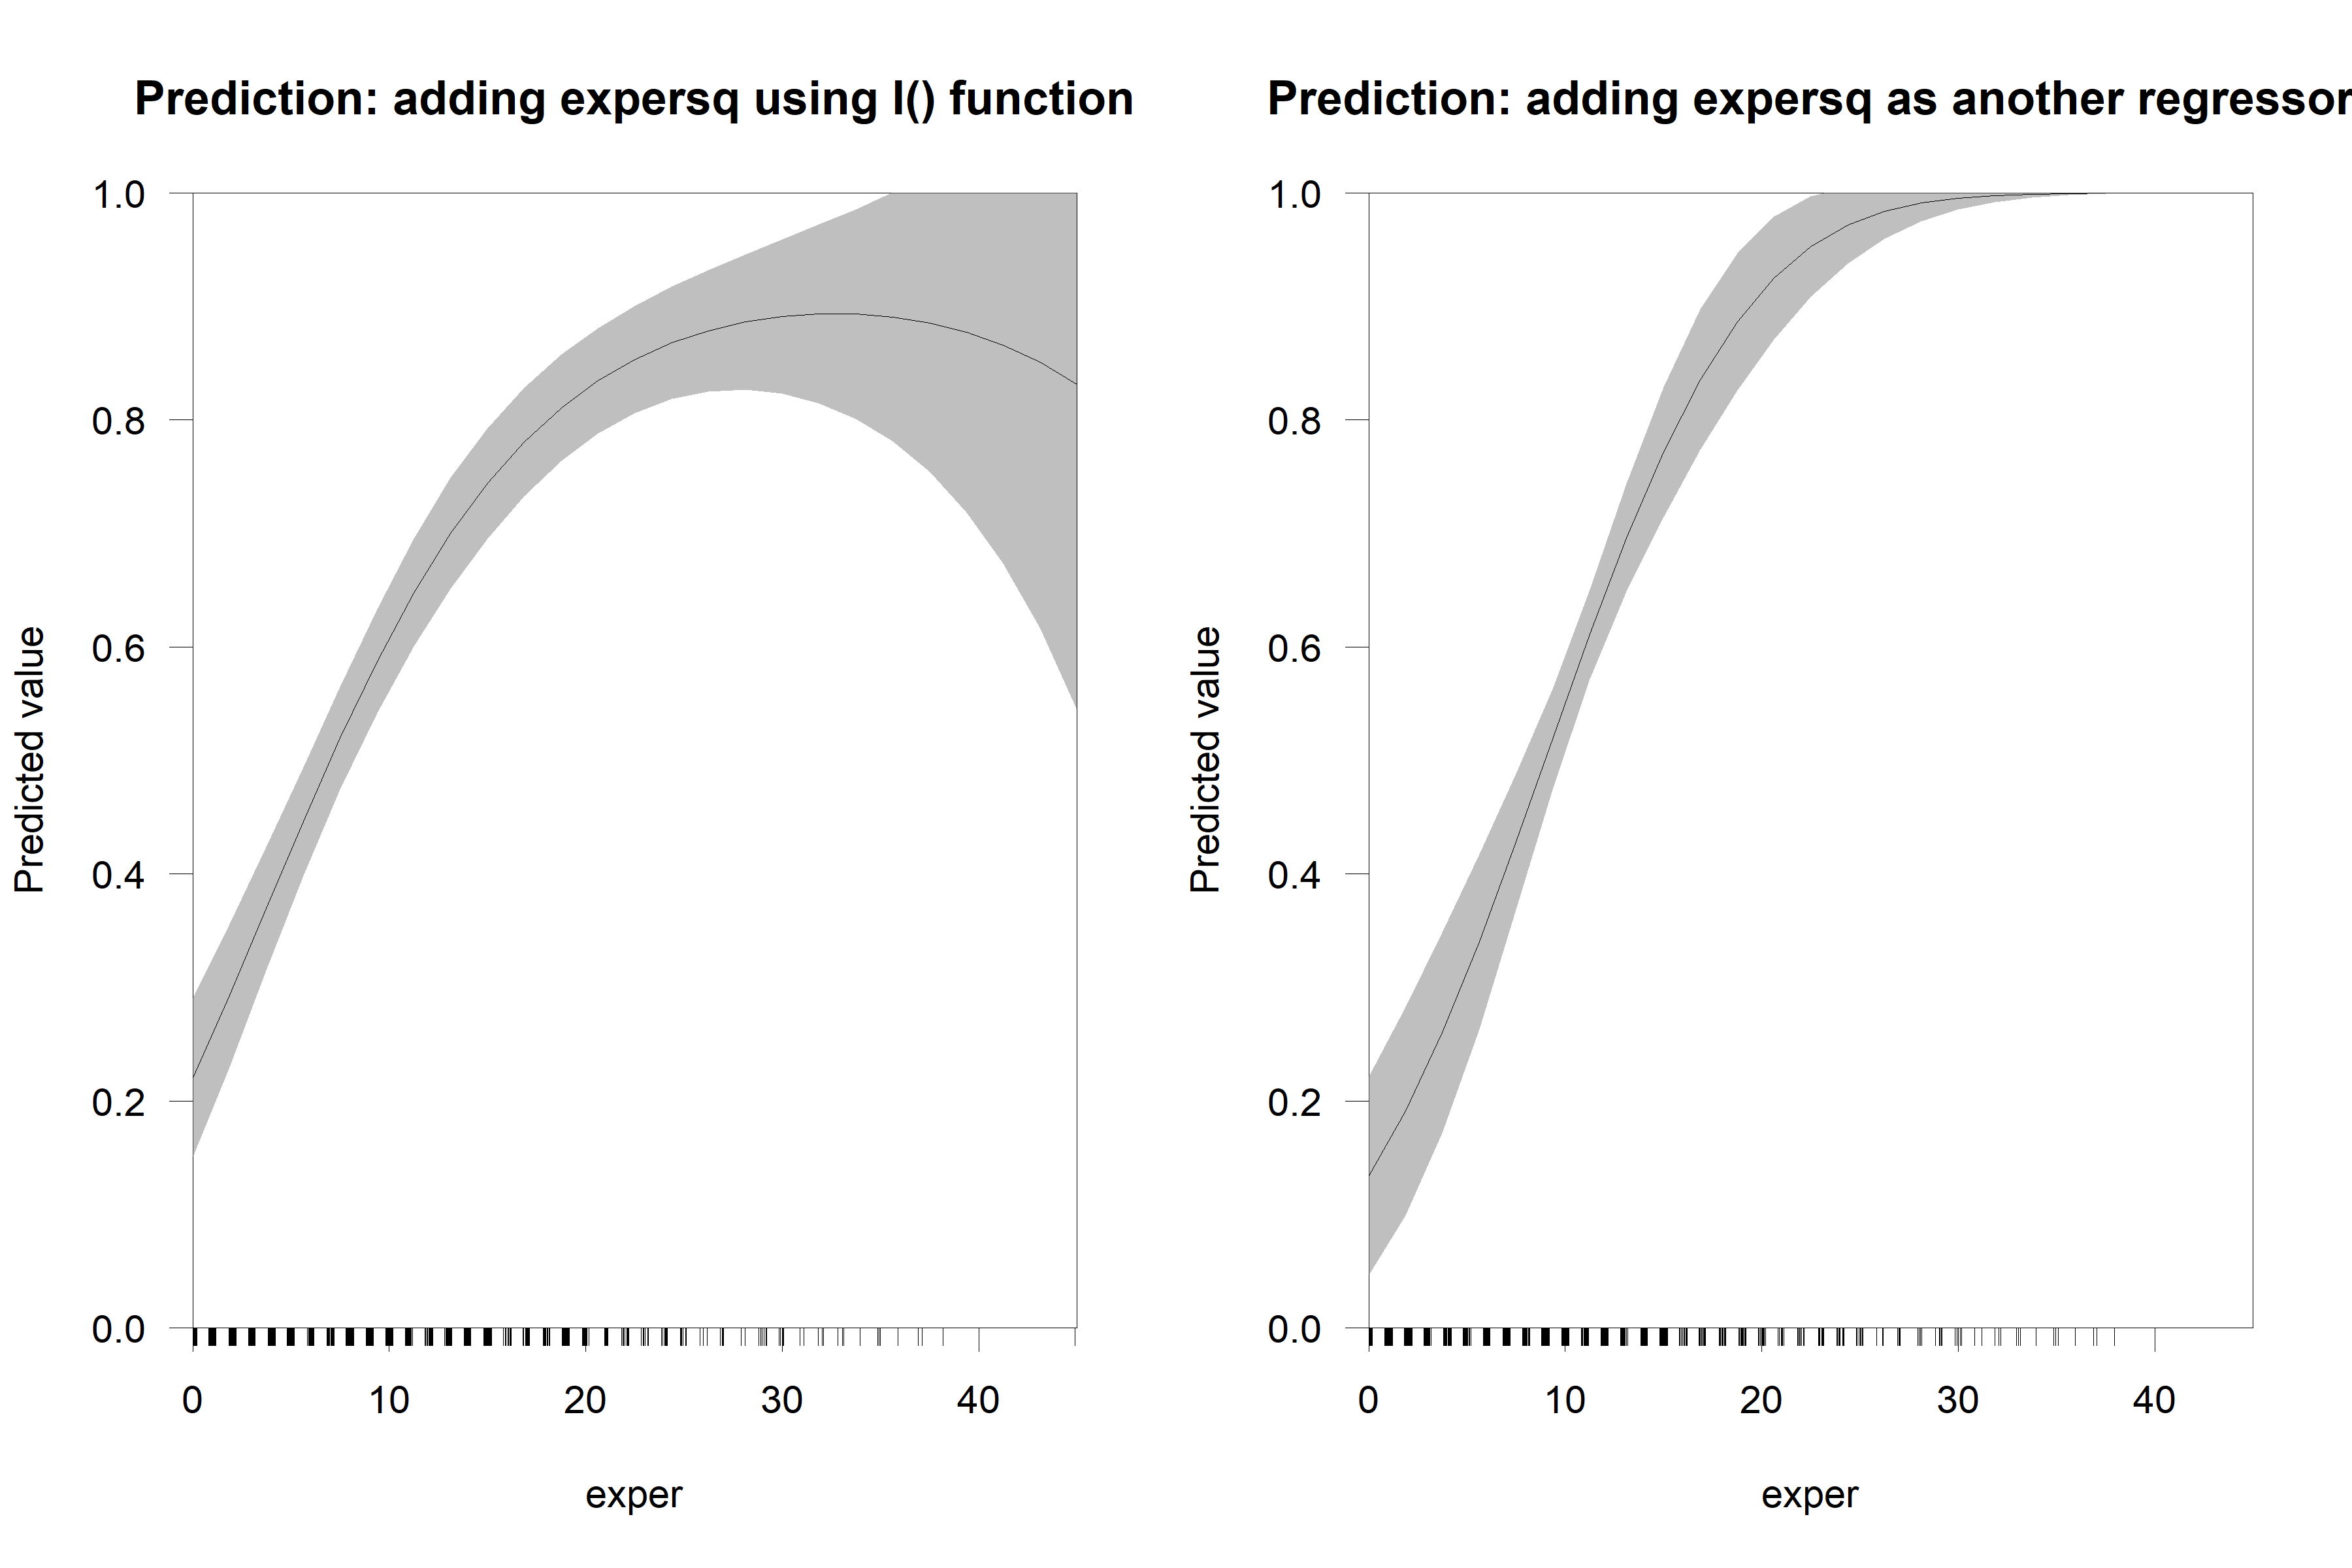
Then, when including the quadratic term in the model its best to do so by making explicit that we are including experience squared and not just another regressor (which happens to be experience squared).
# One way to add experience squared to the model could be to include the variable expersq:

probit_model_exp_1 = glm(inlf ~ nwifeinc + educ + exper + expersq + age + kidslt6 + kidsge6,data=datab, family = binomial(link = "probit"))

# Using the I() function in the model specification allows R to understand that
# the same variable is entering the model with a linear and a quadratic term

probit_model_exp_2 = glm(inlf ~ nwifeinc + educ + exper + I(exper^2) + age + kidslt6 + kidsge6,data=datab, family = binomial(link = "probit"))

# The two models do not produce the same marginal analysis:

par(mfcol=c(1,2))
cplot(object=probit_model_exp_2,x="exper",what="prediction",main = "Prediction: adding expersq using I() function",ylim=c(0,1))
cplot(object=probit_model_exp_1,x="exper",what="prediction",main = "Prediction: adding expersq as another regressor",ylim=c(0,1))
-Stata-

* One way to add experience squared to the model could be to include the variable expersq:

probit inlf nwifeinc educ exper expersq age kidslt6 kidsge6
estimates store probit_model_exp_1

* Using the c.x#c.x interaction synthax in the model specification allows Stata to understand
* that the same variable is entering the model with a linear and a quadratic term

probit inlf nwifeinc educ exper c.exper#c.exper age kidslt6 kidsge6
estimates store probit_model_exp_2

* The two models do not produce the same marginal analysis:

estimates restore probit_model_exp_1

margins, at(exper=(0(1)40))
marginsplot, saving(exp_model_1) title(Pred. margins w/ 95% CIs: added regressor)

estimates restore probit_model_exp_2

margins, at(exper=(0(1)40))
marginsplot, saving(exp_model_2) title(Pred. margins w/ 95% CIs: interaction term)

graph combine exp_model_1.gph exp_model_2.gph


