


Overview
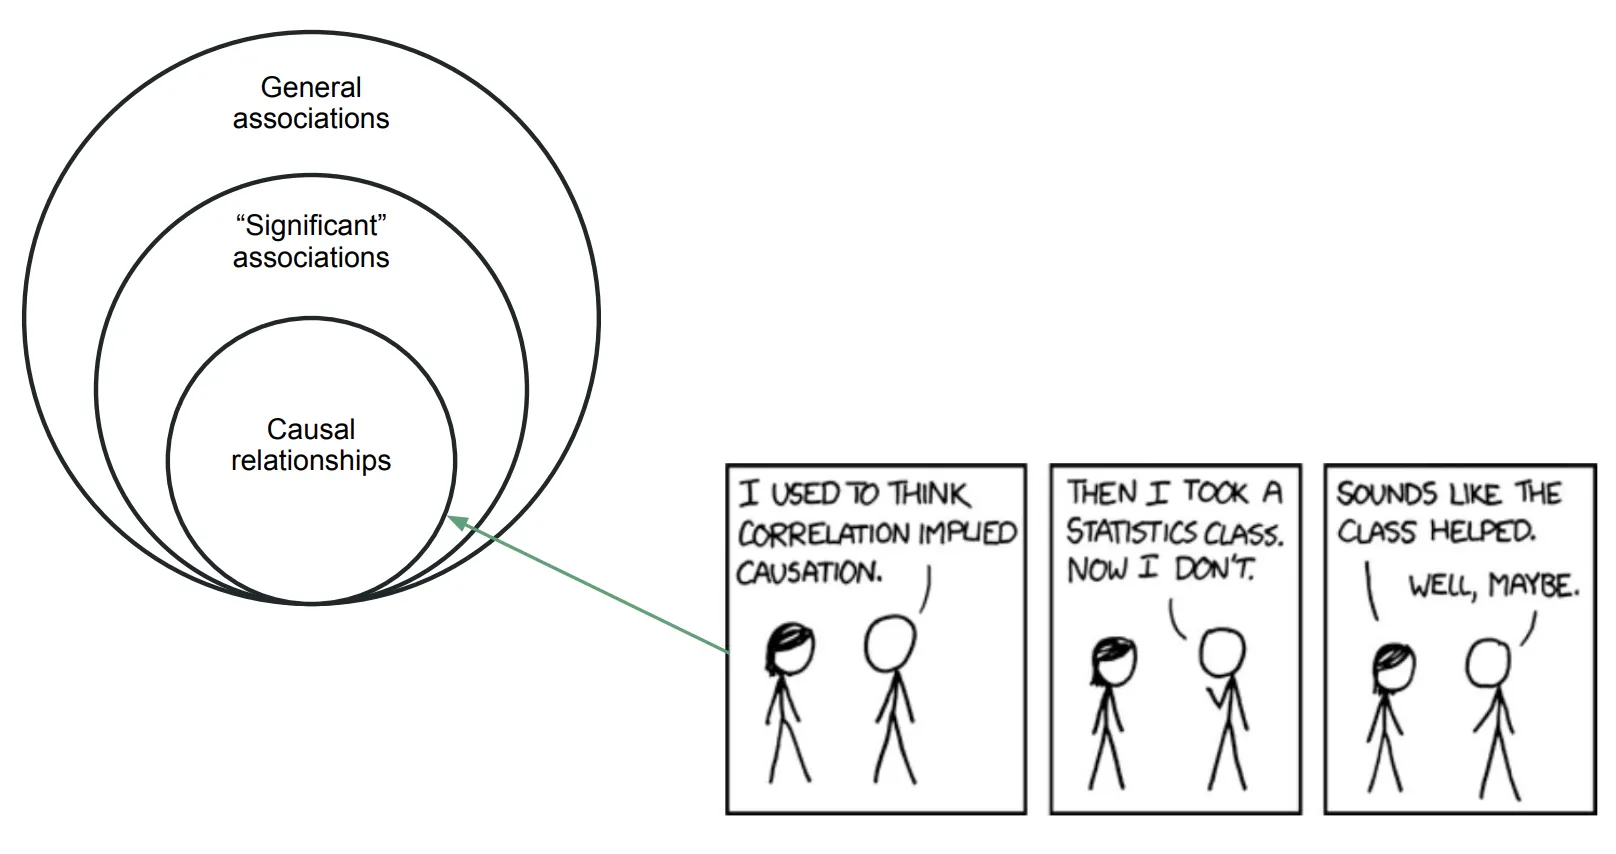
Having the ability to establish causality provides a strong foundation for using the term "because" when making claims about the relationship between certain variables. We are then able to say for instance, that the popularity of a song increased because it was featured in a movie or that the customer bought a given product because they saw an ad and so on. These relationships are not inherently causal, as the direction of cause and effect may be ambiguous, other variables can influence the relationship, or the observed outcome may be due to chance. While regression analysis provides some insight into the significance of associations, interpreting the results as causal relationships requires additional assumptions and thoughtful study designs.
Potential outcomes framework
The potential outcomes framework is central to understanding causal inference and the role of randomization. In this framework, each unit has two potential outcomes: - $Y_i^1$ if the unit receives treatment and - $Y_i^0$ if it did not
The observable outcome $Y_i$ is determined by a switching equation:
$$ Y_i = D_i Y_i^1 +(1-D_i) Y_i^0 $$
Here, $D_i$ is the treatment indicator, taking the value 1 if the unit is treated and $0$ if not. This equation indicates that: - When $D_i = 1$, the observable outcome $Y_i$ is $Y_i^1$ and - when $D_i = 0$, the observable outcome $Y_i$ is $Y_i^0$.
The core of causal inference lies in comparing these potential outcomes. To know the individual treatment effect, you would want to take the difference $Y_i^1$ - $Y_i^0$. However, this is not possible since only one of these outcomes is observed. This challenge arises from the unobserved counterfactual: we cannot see what would have happened under the alternative scenario.
Randomization
Randomization is key to isolating causal effects. By randomly assigning some units to treatment and some units to control, the mean of a random sample from the population of units is then an unbiased estimator for the mean of the population. The counterfactual is based on random selection into treatment. However, random interventions are often infeasible or unethical. Causal inference bridges the gap between the observational data and the hypothetical scenario in which randomization took place.
Selection bias
If a treatment group is NOT randomly selected and treated individuals self-select into treatment, selection bias arises. This means the treatment group would have a different outcome than the control group even without treatment. Consequently, the estimated average treatment effect may be over- or underestimated.
As a simple example, say you are interested in the effect of extra advanced classes on final grades. Just comparing the average grades of the group that signed up for these classes (the treatment group) with that of the group that did not (the control group) may overestimate the effect. This bias comes from different characteristics between these groups that are confounding the treatment effect. For example, the treatment group may on average be more motivated already, which overestimates the effect the classes have on grades.
The estimated treatment effect thus consists of two parts: the unit causal effect + the selection bias (the second line) =
- Unit causal effect: Difference in outcome for treated units and untreated units
- Selection bias: Difference in outcome between the treatment and control group when neither is treated.
Average treatment effects
Following this reasoning, three parameters are distinguished. Depending on your research question, all three may be of interest, though the first two are typically the most important.
- The Average Treatment Effect (ATE) is the difference between the potential outcomes if all units receive treatment and the potential outcomes when no units receive treatment. In mathematical terms:
Again, since ATE requires one to know BOTH potential outcomes but we observe only one it is unobserved but can be estimated.
- The Average Treatment Effect on the Treated Units (ATT) is the treatment effect for only the treatment group. It is likely to be different from the ATE if individuals self-select into treatment, and therefore treatment units differ from control units in other characteristics. In our example, it is the effect of attending advanced classes on final grades for the group that attended these classes.
- The Average Treatment Effect for the Untreated (ATU) is the treatment effect for those individuals in the control group. The ATU is likely to be different from the ATT, if self-selection made the treatment and control group differ on certain characteristics that affect the outcome variable. In our example, the ATU is the effect of advanced classes on the final grades of people that did not attend.
 Summary
Causal inference methods are essential for understanding the impact of variables on outcomes. The potential outcomes framework lays the conceptual framework for causal inference. Understanding the role of randomization and selection bias is essential for reliable causal inference.
-
The Average Treatment Effect (ATE) represents the average effect of treatment on all units.
-
The Average Treatment Effect on the Treated (ATT) focuses on the treated units, while the Average Treatment Effect for the Untreated (ATU) focuses on the control group.
Navigate to the "Causal Inference" section for applications on the following causal inference methods: