Overview
Regression analysis is a powerful tool to estimate relationships between variables. Refer to this topic for the foundamental basics of regression analysis.
In this topic, we explore the regression output summary in R, with step-by-step explanations and suggestions for interpreting your results. Whether you’re starting out with linear regression in R or seeking a comprehensive guide to refer back to as experienced user, this topic is meant for you.
Load packages and data
Begin by loading our sample dataset. We use the PIAAC survey, measuring adults' proficiency in key information-processing skills: literacy, numeracy, and problem-solving. Data adjustments are made beforehand to ensure variables are in the correct format. Load the data set in R yourself by running the following code.
# Load data
data_url <- "https://raw.githubusercontent.com/tilburgsciencehub/website/master/content/topics/Analyze/Regression/linear-regression/piaac.Rda"

load(url(data_url)) #piaac is the cleaned data set
As an example, we investigate the relationship between years of education and hourly wage, expressed in the following regression:
\(Wage = \beta_0 + \beta_1 * Education + \epsilon \)Where:
- Wage (
earnhr) is the dependent variable, the hourly wage of survey participants - Education (
yrsqual) is the independent variable, indicating the number of years of education - $\epsilon$ denotes the error term
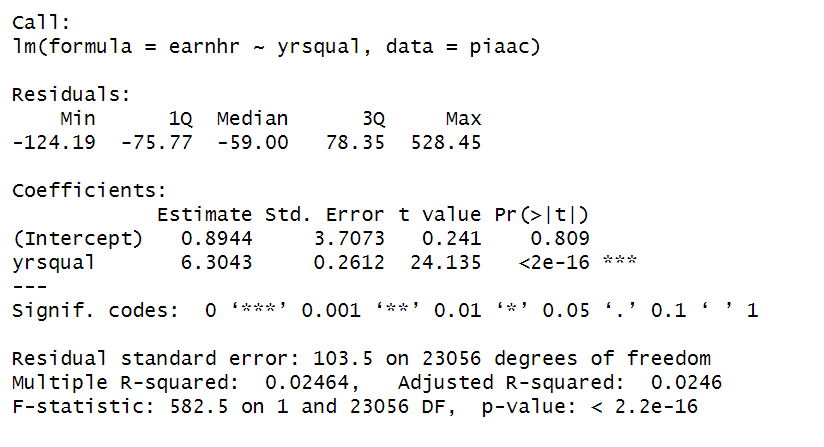
The lm() function is used to perform the regression of hourly wage (earnhr) on years of education (yrsqual), with summary() providing an overview of regression output.
 Tip
TipThe simple linear regression is used to understand the relationship between a linear independent and dependent variable. For interpretation of different functional forms (e.g. one variable in log) or multivariate regression scenarios with multiple independent variables, refer to this topic on interpreting regressions of different functional forms.
We will analyze the output step by step:
Call
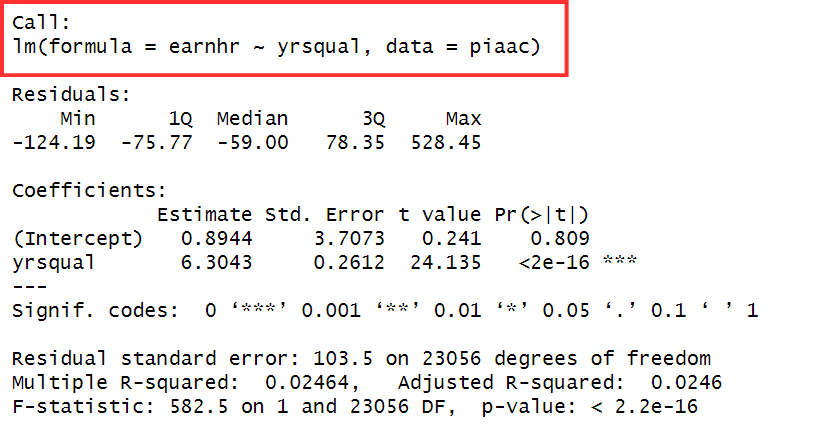
The call section shows the formula used for the regression analysis, indicating the dependent variable, independent variable, and dataset.
Residuals
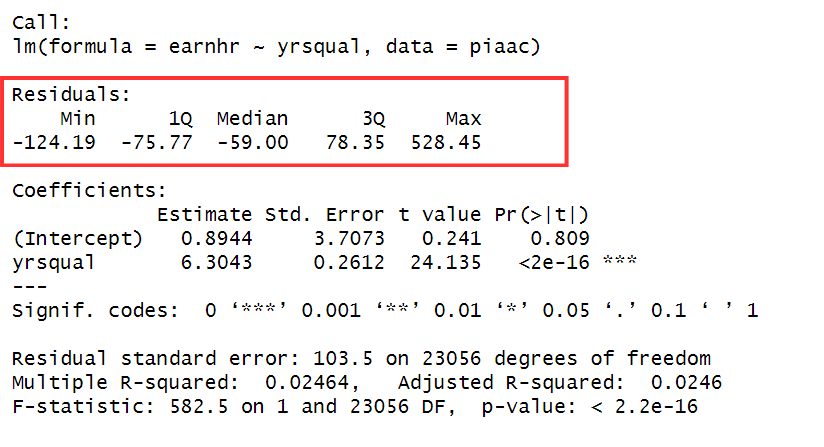
Residuals, or errors, represent the difference between the observed and the predicted values of the dependent variable.
The summary output provides:
Min: Minimum residual value1Q: First quartile, the value below which 25% of the residuals lie.Median: Median, the midpoint of the residual values, separating the lower 50% from the upper 50%.3Q: Third quartile, the value below which 75% of the residuals lie.Max: Maximum residual value
For a linear regression model to be unbiased, the residuals are assumed to be evenly distributed around zero, indicating that the errors are simply random fluctuations around the true line and the model is equally likely to overestimate or underestimate the dependent variable’s value.
While the summary output can provide an initial insight into the distribution of residuals, it is typically not the primary tool for directly assessing the assumption on residuals. This topic elaborates on model assumptions including the one about the model’s residuals.
 Tip
TipA brief overview of the regression output reveals some characteristics about the distribution of the residuals already.
E.g, the negative median (-59.00) tells us that a significant portion of the residuals falls below zero. Moreover, the maximum (528.45) is substantially larger than the median, suggesting the presence of outliers in the upper tail of the distribution. The minimum residual (-124.19) being closer to the median suggests a more compact distribution towards the lower end of the range. In summary, the distribution appears right-skewed and a residual plot will clarify this.
Coefficients
The coefficients section provides information about the estimated relationships between the independent and dependent variables in the model.
Estimate
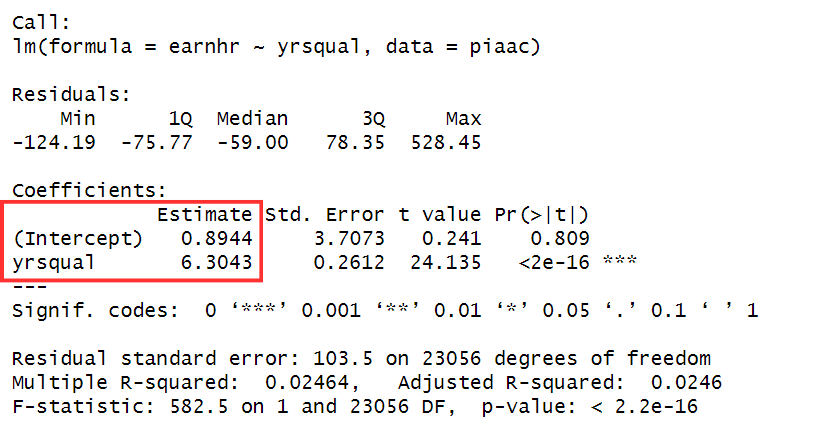
The estimate column displays the coefficients for each predictor in the model. These coefficients represent the expected change in the dependent variable (Y) for a one-unit change in the predictor variable (X), holding all other variables constant.
- Intercept term
The first estimate is of the intercept term, which represents the predicted value of the dependent variable when all predictor variables are set to zero.
 Tip
TipNote that the interpretation of the intercept may not be meaningful if the independent variable(s) cannot realistically take on a value of zero in the dataset. Like in our example, where the minimum value of years of education is 5, indicating that all surveyed individuals completed at least 5 years of education.
- Independent variables
The estimates for the independent variables indicate the predicted effect of each predictor variable on the dependent variable. In our example, a one-unit increase in the years of education is associated with a 6.30 point increase in hourly wage.
The standard error
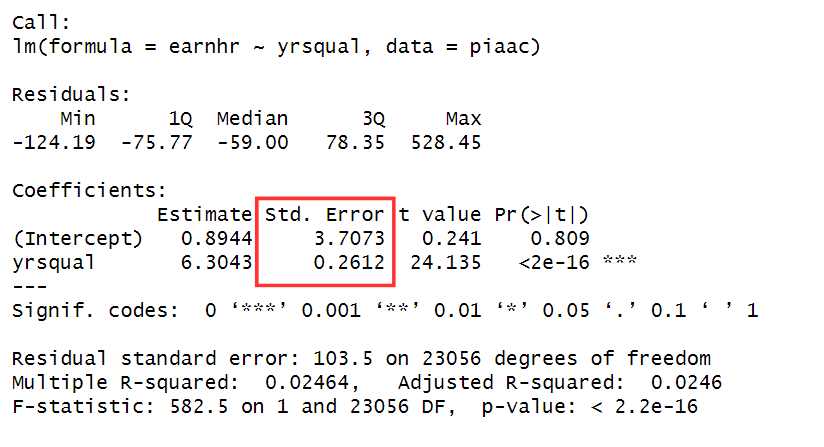
The standard error provides an estimate of the uncertainty associated with the coefficient estimates. Put simply, it tells us how much we would expect the coefficient estimate to vary if multiple samples were drawn from the population.
 Tip
TipUsing the standard error, you can create confidence intervals (CI) that provide a range of plausible values for the true population parameter. For instance, a 95% CI contains the true population parameter with 95% confidence. This means that when you re-estimate the model, your estimate will fall in this range in 95% of the cases.
The formula:
CI = $\hat{\beta}$ ± 1.96 x SE($\hat{\beta}$)
For example, the CI around the coefficient for years of education is calculated as follows:
6.30 ± 1.96 x 0.26 = (5.79, 6.81)
Reporting the 95% CI around the estimated effect is useful. Even when the estimate is significant, uncertainty about the precision persists. The CI illustrates this uncertainty. You can compute the CI with confint() in R.
The following output is returned:
| 2.5% | 97.5% | |
|---|---|---|
| (Intercept) | -6.372143 | 8.160895 |
| yrsequal | 5.792316 | 6.816283 |
t-value
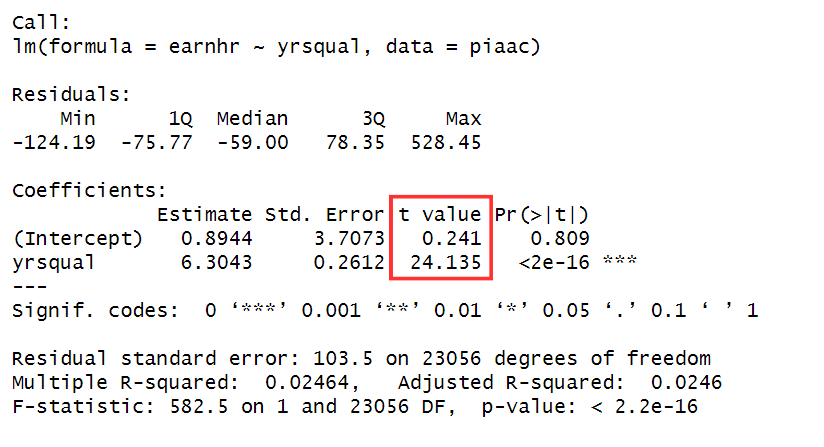
The t-value is computed by dividing the coefficient estimate by the standard error.
Essentially, a larger t-value suggests that the standard error is relatively small compared to the size of the coefficient. Therefore, a higher t value indicates greater confidence that the coefficient is not zero.
Pr(>|t|): p-value
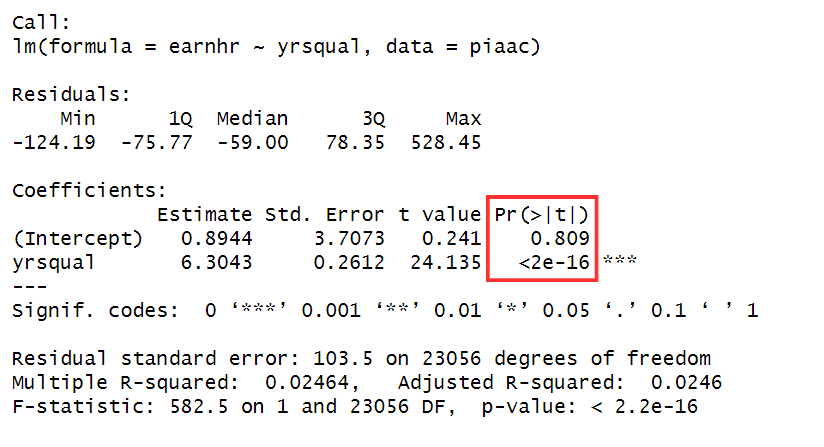
The p-value of each estimate indicates the probability of observing a t-value as extreme as, or more extreme than, the one calculated from our sample data, assuming that the null hypothesis is true (i.e., the true population coefficient is zero).
In other words, the p-value represents the probability of finding an effect, when there is no effect.
If this p-value is small enough, e.g. lower than the commonly used threshold of 5% (0.05), the observed relationship between the predictor variable and outcome variable is unlikely to have occurred by random chance alone. This is evidence supporting a statistically significant relationship between the predictor and the outcome variable.
Significance stars
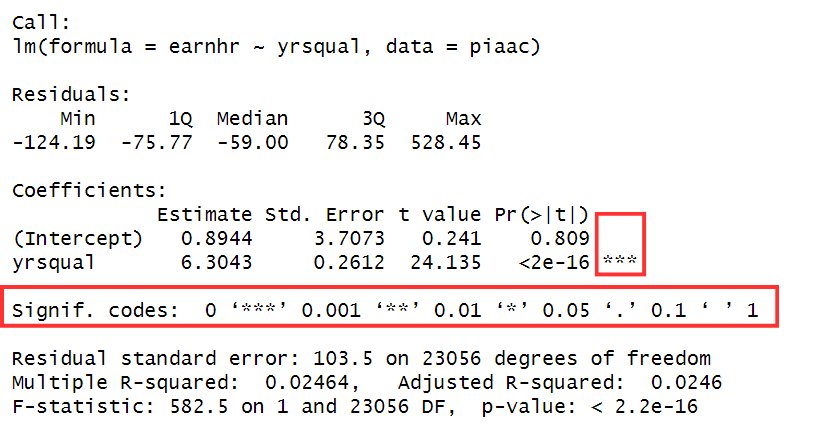
The stars represent significance codes and visually indicate the level of significance determined by the p-value. For instance, the estimate for yrseduc is statistically significant at a 0.1% level (***). If no stars are present, as with the intercept, it indicates an insignificant estimate.
These significance codes are displayed below the Coefficients section, with significance at respectively 1%, 5%, and 10% levels denoted with two stars (**), one star (*), and a dot (.).
 Tip
Tip-
A statistically insignificant coefficient (e.g. p-value > 0.05) does not necessarily imply the absence of an effect. Instead, it suggests that the evidence against the null hypothesis (i.e., no effect) is not strong enough to reject it. When reporting non-significant results, it is more accurate to state that you don’t find evidence for a relationship between X and Y, rather than concluding there is no relationship.
-
When reporting a statistically significant effect, it is crucial to assess its magnitude. For instance, a statistically significant effect can be too small to have a significant impact in economic terms. One approach is to express the effect as a percentage; in linear models, divide the coefficient by the baseline mean of the outcome variable and multiply by 100%.
Other information
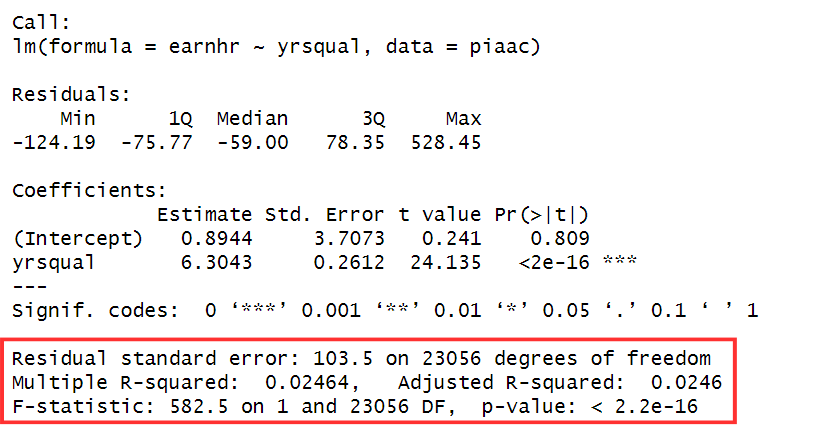
Residual standard error
The residual standard error is an overall measure of how well the regression model fits the observed data. It indicates the average amount by which the observed values of the dependent variable (Y) deviate from the predicted values by the regression model, in the units of the dependent variable.
It provides a summary measure of the overall model fit, and a smaller residual standard error indicates a prediction line of the model closer to the actual values on average.
Multiple and Adjusted R-squared
The multiple R-squared measures the proportion of variation in the dependent variable that is explained by the independent variable(s). For example in our model with a $R^2$ 0.02464, 2.5% of the variability in the hourly wage is accounted for by the years of education of a survey participant.
The adjusted R-squared is a modified version and penalizes the inclusion of unnecessary predictors; this term decreases when additional predictors are added that do not significantly improve the model’s fit. Therefore, it provides a more accurate reflection of the model’s explanatory power.
 Tip
TipNote that a low R-squared value does not necessarily indicate a poor model and a high R-squared value does not necessarily imply a good model. Interpret these values in the context of your specific model.
F-statistic and p-value
The F-statistic and its associated p-value are used to test the overall significance of the regression model. The null hypothesis assumes no relationship between the independent variables and the dependent variable, while the alternative hypothesis suggests otherwise.
While the F-statistic assesses the overall fit of the model, it’s generally better to rely on the p-value for determining the significance of the relationship between the variables.
 Tip
TipNow that you’ve mastered the interpretation of your findings, it is time to transform your summary output into polished regression tables to present you findings. Head over to this topic on the modelsummary package for a detailed guide and a code example on how to make regression tables.
 Summary
When interpreting a regression summary, it is important to assess the entire output before concluding the relationship between variables. Interpret the standard error and significance level alongside the coefficients. Additionally, consider reporting confidence intervals for the coefficients which provides insight into the precision of the estimates. Remember to interpret results considering both statistical significance and practical significance.


