Overview
In this example, we will analyze how to interpret linear regression models in R. This artice will discuss:
- The interpretation of single-variable regression models.
- Changes in the interpretation when a logarithmic transformation is performed.
- Similarly the interpretation of multi-variable regression models are discussed.
- An explanation of the differences in interpretation of
single-variableregression models andmultivariableregression models is given.
For concrete examples in R, we will make use of the PIAAC survey. PIAAC is a programme of assessment and analysis of adult skills. The Survey measures adults’ proficiency in key information-processing skills: literacy, numeracy and problem-solving.
The regression tables are displayed using the package modelsummary. For an explanation of how to use this package, see this topic.
# Load packages
library(modelsummary)
library(stringr)
library(readr)

# Modelsummary setup
gm <- list(
  list("raw" = "nobs", "clean" = "Sample size", "fmt" = 0),
  list("raw" = "r.squared", "clean" = "R<sup>2</sup>", "fmt" = 2),
  list("raw" = "adj.r.squared", "clean" = "Adjusted R<sup>2</sup>", "fmt" = 2))
notes <- c('* = .1', '** = 0.05', '*** = .01')

# Downloading the dataset
data_url <- "https://raw.githubusercontent.com/tilburgsciencehub/website/topic/interpret-summary-regression/content/topics/Analyze/Regression/linear-regression/piaac.Rda"

load(url(data_url))
Single-Variable Regression Models Interpretation
In this section, we will discuss single-variable regression models and how to interpret them. Single-variable models can be seen as models with one independent/explanatory variable (X) that tries to explain the dependent variable (Y).
The Linear-Linear Model
The Linear-Linear model is a type of model where the dependent variable, Y, and the independent variable, X, are not transformed in any way. This means that they are both in their original form or levels. Mathematically, such models can be expressed as follows:
In the simplest form, the explanation goes as follows: If X goes up by 1, then Y goes up by $\beta_1$.
In symbols this would mean:
\( △Y = \beta_1 · △X\)In words, if we change X by 1 unit (i.e. $△X = 1$) then we can expect Y to change by $\beta_1$ units.
 Tip
TipIf the dependent variable (Y) would be dichotomous, meaning either a 0 or 1. Then a change in X would mean that Y changes by $\beta_1 * 100$ and would state the change in percentage points of Y.
Here is a regression, that tries to explain the hourly wage given the years of education.
# Regression
LinearLinear <- lm(earnhr ~ yrsqual, data = piaac)

# Model Output
cm_1 = c('yrsqual' = 'Years of Education')
titleLinLin <- 'Table 1: Single-Variable Linear-Linear Regression Model Results'
msummary(LinearLinear,
         fmt = 3,
         stars  = c('*' = .1,
                    '**' = 0.05,
                    '***' = .01),
         estimate = "{estimate}",
         statistic = "[{std.error}]{stars}",
         coef_map = cm_1,
         gof_omit = 'AIC|BIC|RMSE|Within|FE',
         gof_map = gm,
         title = titleLinLin,
         notes = notes)
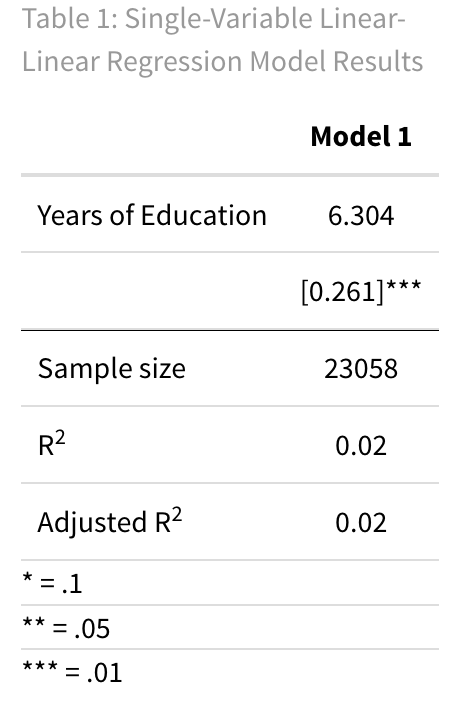
The linear-linear regression above can be interpreted as follows: For each additional year of education ($\triangle X =1$), the hourly wages ($\triangle Y$) is expected to increase by 6.304.
 Tip
TipAvoid language stating a causal effect. Instead, we are stating the correlation between the dependent variable and an explanatory variable based on predictor variables. Therefore, be cautious with your interpretation statement. As here we are careful to avoid saying “a one-unit increase in education raises the hourly wage by 6.30”. This would imply that we have estimated a causal effect. The correct phrasing reflects that we’re discussing correlations, not causation.
The Linear-Log Model
The Linear-Log model is a model where the dependent variable (Y) has not been transformed, while the independent variable (X) has been transformed to a logarithmic scale. These types of models can be mathematically expressed as follows:
We can interpret $\beta_1$ as follows: “A one-unit change in ln(X) corresponds to a change of $\beta_1$ units in Y.”
To simplify this, let’s break it down logically. Linear changes in ln(X) relate to proportional changes in X. Mathematically, ln(AB) = ln(A) + ln(B). So if we start with ln(X) and add 1 to it, we get 1 + ln(X) = ln(e) + ln(X) = ln(eX).
Adding something to ln(X) is the same as multiplying something by X.
Now, if we add an arbitrary value, let’s call it “c,” it’s like multiplying X by $e^c$.
Here’s the clever part: if c is really close to 0, then $e^c$ is almost 1 + c.
For example, say c = 0.05. This is approximately the same as multiplying X by 1.05, or in simpler terms, a 0.05 increase in ln(X) is pretty much a 5% increase in X.
In symbols, this will look as follows:
\(△Y = \beta_1 ·△ \% X \)Therefore, in a linear-log model, the interpretation is that a 100% increase in X is associated with a $\beta_1$ unit change in Y.
Let’s look at an example, to make things clear!
# Regression
LinearLog <- lm(earnhr ~ log(yrsqual), data = piaac)

# Model Output
cm_2 = c('log(yrsqual)' = 'Logarithmic Scale Years of Education')
titleLinLog <- 'Table 2: Single-Variable Linear-Log Regression Model Results'
msummary(LinearLog,
         fmt = 3,
         stars  = c('*' = .1,
                    '**' = 0.05,
                    '***' = .01),
         estimate = "{estimate}",
         statistic = "[{std.error}]{stars}",
         coef_map = cm_2,
         gof_omit = 'AIC|BIC|RMSE|Within|FE',
         gof_map = gm,
         title = titleLinLog,
         notes = notes)
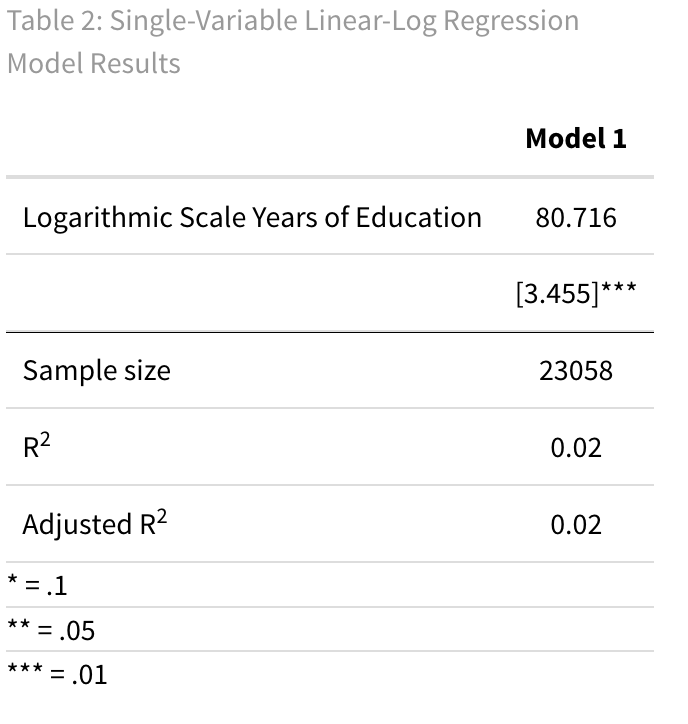
The logarithmic-linear regression above can be interpreted as follows. For a 1% increase in years of education ($\triangle X = 0.01$), the hourly wage is expected to increase by 80.716 · 0.01 = 0.81
 Tip
TipNote that this trick works best for small percentage changes, which is usually what is relevant in social science. However, if you’re dealing with changes larger than 10%, it becomes less reliable. For instance, if you have a 100% change in ln(X), it results in an X change of $e^1 = 2.71$. This is actually a 171% change, not just 100%.
The Log-Linear Model
When using a Log-Linear model, the dependent variable (Y) is expressed on a logarithmic scale, while the independent variables (X’s) remain on their original scale. This means that the model is represented mathematically as follows:
We can apply the same logic from the Linear-Log model, but now a 1-unit change in X is associated with a $\beta_1$-unit change in ln(Y), which then means a $\beta_1$ · 100% change in Y.
In symbols, this would mean
\(△ \% Y = 100· \beta_1 · △X \)So the interpretation is that a 1 unit change in X is associated with a 100 · $\beta_1$ % change in Y. Note again this rule applies only for small changes.
# Regression
LogLinear <- lm(log(earnhr) ~ yrsqual, data = piaac)

# Model Output
cm_3 = c('yrsqual' = 'Years of Education')
titleLogLin <- 'Table 3: Single-Variable Log-Linear Regression Model Results'
msummary(LogLinear,
         fmt = 3,
         stars  = c('*' = .1,
                    '**' = 0.05,
                    '***' = .01),
         estimate = "{estimate}",
         statistic = "[{std.error}]{stars}",
         coef_map = cm_3,
         gof_omit = 'AIC|BIC|RMSE|Within|FE',
         gof_map = gm,
         title = titleLogLin,
         notes = notes)
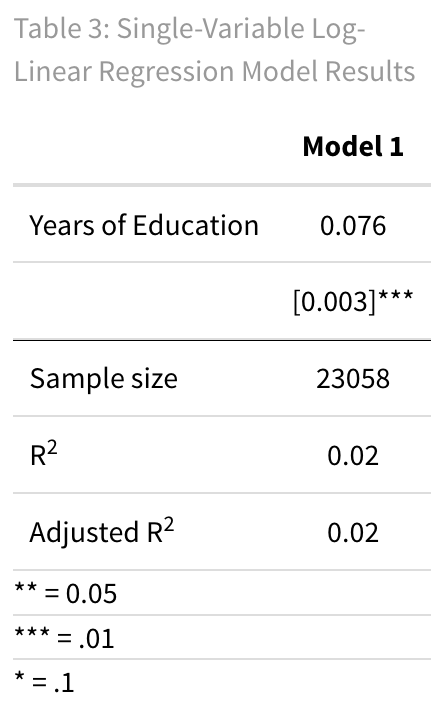
The logarithmic-linear regression above can be interpreted as follows: For each year of education ($\triangle X =1$), the hourly wages is expected to increase by 100 · 0.0764 = 7.64%
The Log-Log Model
The Log-Log Model is one in which both the dependent variable (Y) and independent variable (X) have been transformed to a logarithmic scale. These types of models can be mathematically expressed as follows:
A 10% change in X leads to a corresponding change of 10% · $\beta_1$ in ln(Y). This translates to a 0.1 · $\beta_1$ · 100% or 10 · $\beta_1$% change in Y. It’s important to note that, regardless of the initial percentage increase in X, it results in the same percentage change in Y. This relationship is described by $\beta_1$ as the ‘elasticity.’
For instance, a 10% change in X corresponds to a 10% · $\beta_1$-unit change in ln(Y), equivalent to a 10 · $\beta_1$% change in Y. Regardless of the initial X percentage change, the impact on Y remains consistent. In summary, when applying logarithms to both X and Y, we can simply state that any percentage change in X is associated with $\beta_1$ times the same percentage change in Y.
In symbols, this would mean
△ %Y = $\beta_1$ · △% X
In a log-log model, a 1% change in X is associated with a $\beta_1$% change in Y.
# Regression
LogLog <- lm(log(earnhr) ~ log(yrsqual), data = piaac)

# Model Output
cm_4 = c('log(yrsqual)' = 'Logarithmic Scale Years of Education')
titleLogLog <- 'Table 4: Single-Variable Log-Log Regression Model Results'
msummary(LogLog,
         fmt = 3,
         stars  = c('*' = .1,
                    '**' = 0.05,
                    '***' = .01),
         estimate = "{estimate}",
         statistic = "[{std.error}]{stars}",
         coef_map = cm_4,
         gof_omit = 'AIC|BIC|RMSE|Within|FE',
         gof_map = gm,
         title = titleLogLog,
         notes = notes)
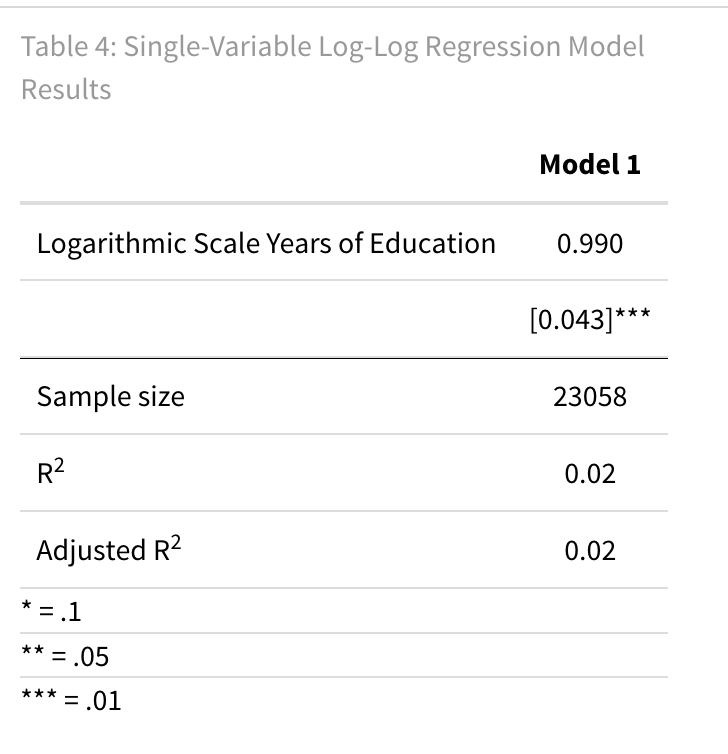
For the model where both the dependent variable and independent variable are transformed to a logarithmic scale, the interpretation goes as follows: For a 1% change in years of education ($\triangle X = 0.01$), hourly wages is expected to increase by 0.99% (0.99 · 0.01).
Multivariable Regression Models Interpretation
Now, let’s delve into the interpretation of models with multiple independent variables. To be precise, the interpretation of a coefficient is denoted as $\beta_1$ for variable X in a regression with more control variables. It will require a concept called Ceteris Paribus, which is Latin for “holding other things constant.” In this section we will limit the explanation to the linear-linear model, as the interpretation differences only differ in the concept of Ceteris Paribus.
For a concrete example, we will once again turn our attention to the PIAAC survey. Specifically, the regression runs the so-called Mincer equation and includes variable transformations within the formula.
The Linear-Linear model
With the introduction of additional variables into the formula, our mathematical model undergoes a transformation. Mathematically, these models can be represented as follows:
\(Y = \beta_0 + \beta_1 X + \beta_2 X_2 + \epsilon \)or more general,
\(Y = \beta_0 + \beta_1 X_1 + \beta_2 X_2 + ... + \beta_k X_k + \epsilon \)Nevertheless, the interpretation of changes in the variable X remains consistent as in the case with a single explanatory variable. This can be higlighted by taking the partial derivative:
\( \frac{dY}{dX_1} = \beta_1 \)This can be interpreted as the rate of change in Y associated with a change in X1 and requires the concept that all the other variables are not changing.
Thus the interpretation remains: When X increases by 1 unit, Y increases by $\beta_1$ units. However, we added a line stating that this happens in Ceteris Paribus.
# Regression
Mincer_LinearLinear <- lm(log(earnhr) ~ experience + yrsqual + gender, data = piaac)

# Model Output
cm_5 = c('experience' = 'Work Experience (Years)',
         'yrsqual' = 'Education (Years)',
         '(gender)' = 'Gender (Women = 1)')
title5 <- 'Table 5: Multivariable Log-Linear Regression Model Results'

msummary(Mincer_LinearLinear,
         fmt = 3,
         stars  = c('*' = .1,
                    '**' = 0.05,
                    '***' = .01),
         estimate = "{estimate}",
         statistic = "[{std.error}]{stars}",
         coef_map = cm_5,
         gof_omit = 'AIC|BIC|RMSE|Within|FE',
         gof_map = gm,
         title = title5,
         notes = notes)
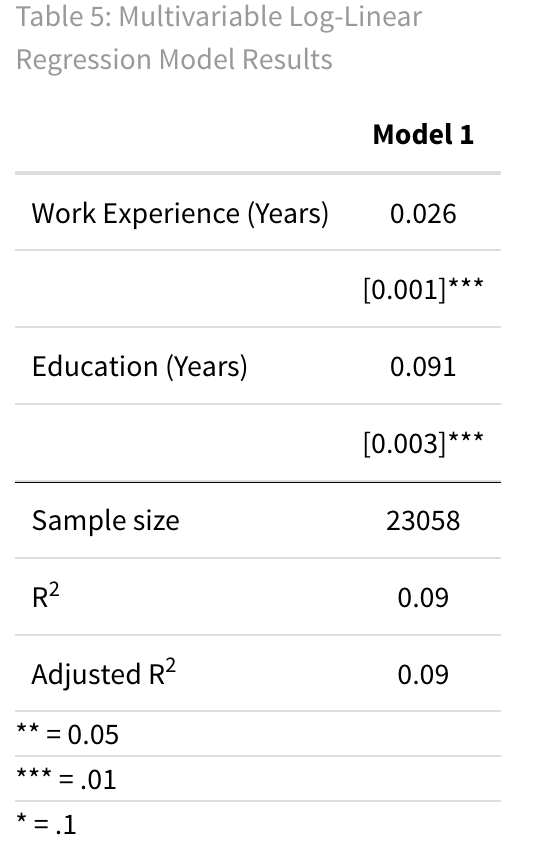
The Log-Linear Model with multiple control variables above can be interpreted as follows: For each additional year of education, yrsqual variable, the hourly wages is expected to increase by 9.1%, Ceteris Paribus.
 Summary
We’ve covered how to interpret regression models in R, both for single-variable and multivariable regressions, using the PIAAC survey data. Here’s a summary of the different types of models and their interpretations:
Linear-Linear Model: In this model, both the dependent variable (Y) and the independent variable (X) are in their original form. The interpretation is straightforward: if X increases by 1 unit, Y increases by $\beta_1$ units.Linear-Log Model: Here, X is transformed to a logarithmic scale while Y remains unchanged. The interpretation is that a 1% increase in X results in a 0.01 · $\beta_1$ unit change in Y.Log-Linear Model: In this model, Y is on a logarithmic scale, while X remains in its original form. A 0.1 unit change in X is associated with a 0.1 · $\beta_1$ · 100% change in Y.Log-Log Model: This model involves transforming both Y and X to a logarithmic scale. The interpretation is that a 1% change in X corresponds to a $\beta_1$% change in Y. This model is especially useful for discussingelasticity. When dealing with multivariable regressions, we introduce the concept of ‘Ceteris Paribus,’ which means that the regression coefficient $\beta_i$ for a variable X signifies “Controlling for the other variables in the model, a one unit change in X is associated with a $\beta_i$-unit change in Y.”
In all cases of regression interpretations, it’s crucial to avoid language that suggests a causal relationship.


