Overview
What are Interaction Terms
Let’s consider an example from economics: the determinants of income. We are interested in understanding how years of education and living in an urban or rural area affect a person’s income. You could start by looking at these variables individually:
- Education: Generally, more education leads to higher income.
- Urban vs. Rural: Living in an urban area might also be associated with higher income due to more job opportunities.
However, what if living in an urban area amplifies the benefits of having more education? Or in other words, does being educated in an urban area lead to significantly higher income compared to being equally educated in a rural area?
This is where interaction terms come into play.
In a standard regression analysis, you use an explanatory variable (X) to understand how it influences the dependent variable, income (Y).
However, when you introduce an interaction term into the regression, you are adding an extra layer to this relationship.
The main idea is that the relationship between X and Y is not solely determined by X; it also varies with another variable, which we’ll call Z. Combing back to our example: the relationship between education and income is not solely determined by education; it also depends on whether a person lives in a rural or urban area.
An interaction term is included in the regression when you multiply two different variables and include their product in the regression. The model is now called a fully interacted model.
Or as in our example:
\( Income = \beta_0 + \beta_1 Education + \beta_2 Area + \beta_3 Education * Area + \epsilon \)How to Interpret Interaction Terms?
The concept of interaction terms can be best explained with calculus. It answers the question: “What is the impact of X when it interacts with another variable, Z?"
The answer can be found by taking the derivative of the main formula. We take out of the regression equation, the derivative with respect to X. That’s it!
So, The fully interacted model:
and its derivative:
\( \frac{\partial Y}{\partial X} = \beta_1 + \beta_3 Z \)
This represents the effect of X on Y, which is now conditional on Z! For those unfamiliar with calculus, look how we just took the terms with an X including $\beta_1 X$ and $\beta_3 X Z$ and took out the X, leaving us with the expression above.
There is now not a single effect of X on Y. Rather, we state the effect of X at a given value of Z.
Consequently, individual coefficients like $\beta_1$ no longer convey “the effect of X.” When examining effect size, we must account for the complete influence.
The interpretation of the interaction term, which is $\beta_3$, is as follows:
In the derivative we discussed earlier, where we explained the effect of X on Y, the interaction term simplifies to $\beta_3 Z$. Now, the coefficient $\beta_3$ tells us how our prediction of $\frac{\partial Y}{\partial X}$ changes when Z increases by one unit.
In other words, $\beta_3$ quantifies how much stronger the effect of X on Y becomes when Z increases by one unit.
Word of caution
Using interaction terms can increase the likelihood of detecting significant effects, but it can also lead to a random significance, especially with numerous covariates. To maintain research credibility, avoid a “fishing expedition” approach. Recognize the exploratory nature of interaction effects and document all analyses.
Scenario Analyses
In this section, we will perform multiple regression analyses, each illustrating a different scenario. We will explore scenarios involving continuous and discrete independent variables, continuous and discrete dependent variables, and models with and without control variables. Additionally, when examining discrete variables, we will explore interactions in both binary and multi-level contexts.
The scenario analysis will use a public dataset CPS1988, which is open source and can be downloaded using the AER package in R. It contains cross-section data originating from the March 1988 Current Population Survey by the US Census Bureau.
It contains the following variables:
- Wage: Dollars per week.
- Education: Number of years of education.
- Experience: Number of years of potential work experience.
- Ethnicity: Factor with levels “cauc” and “afam” (African-American).
- Smsa: Factor. Does the individual reside in a Standard Metropolitan Statistical Area (SMSA)?
- Region: Factor with levels “northeast”, “midwest”, “south”, “west”.
- Parttime: Factor. Does the individual work part-time?
Short remark: CPS data lacks direct work experience information, so a common workaround is to estimate potential experience as age minus education minus 6. This method can result in negative experience values for some respondents.
I will use the modelsummary package, to present the regression output. For a guide, about the package and how it works look at the following topic.
# Loading packages
library(modelsummary)
install.packages('devtools', repos = 'http://cran.us.r-project.org')
devtools::install_github('xuyiqing/interflex')
library(interflex)

# Setting up modelsummary
gm <- list(
  list("raw" = "nobs", "clean" = "Sample size", "fmt" = 0),
  list("raw" = "r.squared", "clean" = "R<sup>2</sup>", "fmt" = 2),
  list("raw" = "adj.r.squared", "clean" = "Adjusted R<sup>2</sup>", "fmt" = 2))
notes <- c('* = .1', '** = .05', '*** = .01')

# Loading in the dataset
data("CPS1988", package = "AER")

# Create discrete binary independent variables
CPS1988$ethnicity <- ifelse(CPS1988$ethnicity == "afam", 1, 0)
CPS1988$parttime <- ifelse(CPS1988$parttime == "yes", 1, 0)
CPS1988$smsa <- ifelse(CPS1988$smsa == "yes", 1, 0)
1. Discrete Binary Independent variable without controls
To construct a regression model with interaction effects in R, we must incorporate interaction terms into our model. We use an asterisk “*” to denote the interaction term, and R will automatically include both separate variables involved in the interaction in the regression model.
Here, we’re studying a model that tries to understand how a person’s wage (Y) is affected by their level of education (X). We’re also looking into whether a person’s ethnicity (Z) plays a role in mediating or influencing this relationship. Notice that ethnicity is a binary indicator, separating the data into two groups.
# Regression 1
reg1 <- lm(wage ~ education * ethnicity, data = CPS1988)

# Model Output
titlereg1 <- 'Table 1: Discrete Binary Independent Variable Model without controls'
msummary(reg1,
         fmt = 4,
         stars  = c('*' = .1,
                    '**' = 0.05,
                    '***' = .01),
         estimate = "{estimate}",
         statistic = "[{std.error}]{stars}",
         gof_omit = 'AIC|BIC|RMSE|Within|FE',
         gof_map = gm,
         title = titlereg1,
         notes = notes)
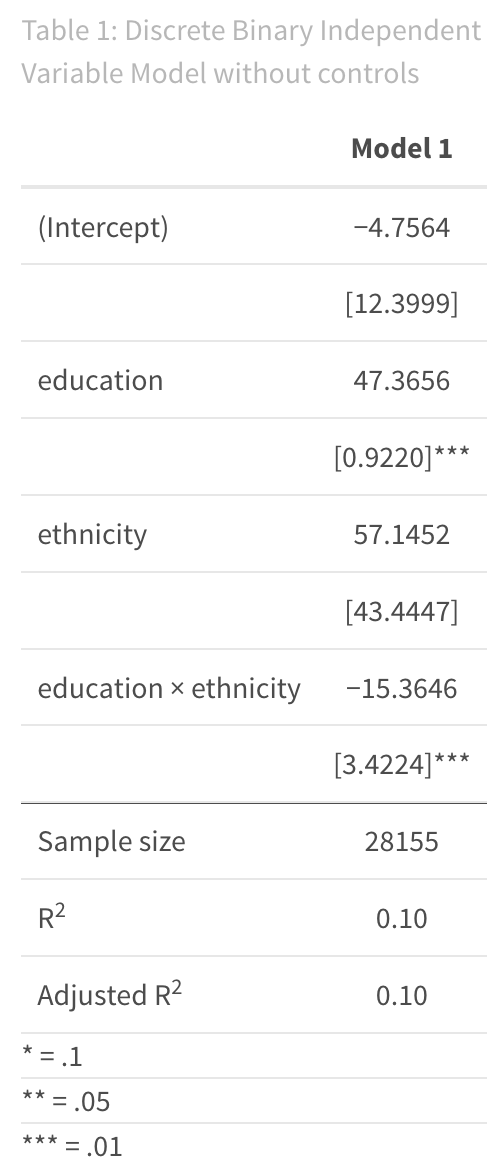
The interpretation of the regression output is as follows: Based on this specific dataset and model, we observe that a one-year increase in education is associated with an expected wage increase of 47.366 dollars ($\beta_1$).
However, it’s important to note that this relationship is influenced by a person’s ethnicity, look at the significance level of the interaction term. For African Americans, each additional year of education leads to an expected wage increase of 32.001 dollars ($\beta_1 + \beta_3$). which is calculated as 47.366 (the effect of education for the general population) plus -15.365 (the interaction effect for African Americans).
 Tip
TipIt’s always beneficial to plot interaction terms for a clearer understanding of their impact. This marginal effect plot is a useful way to visualize how one variable modifies the effect of another on the outcome. For a quick guide on marginal effects in R, you can refer to this topic. In this discussion, I will utilize the R package called “ggpredict,” which enables us to generate marginal effect plots by combining the function with ggplot.
plot1 <- ggpredict(model = reg1, terms = c("education", "ethnicity"))

ggplot(plot1, aes(x, predicted, colour = group)) +
  geom_line() +
  labs(x= "Years of Education",
       y = "Wage",
       colour = "Ethnicity: African American = 1")
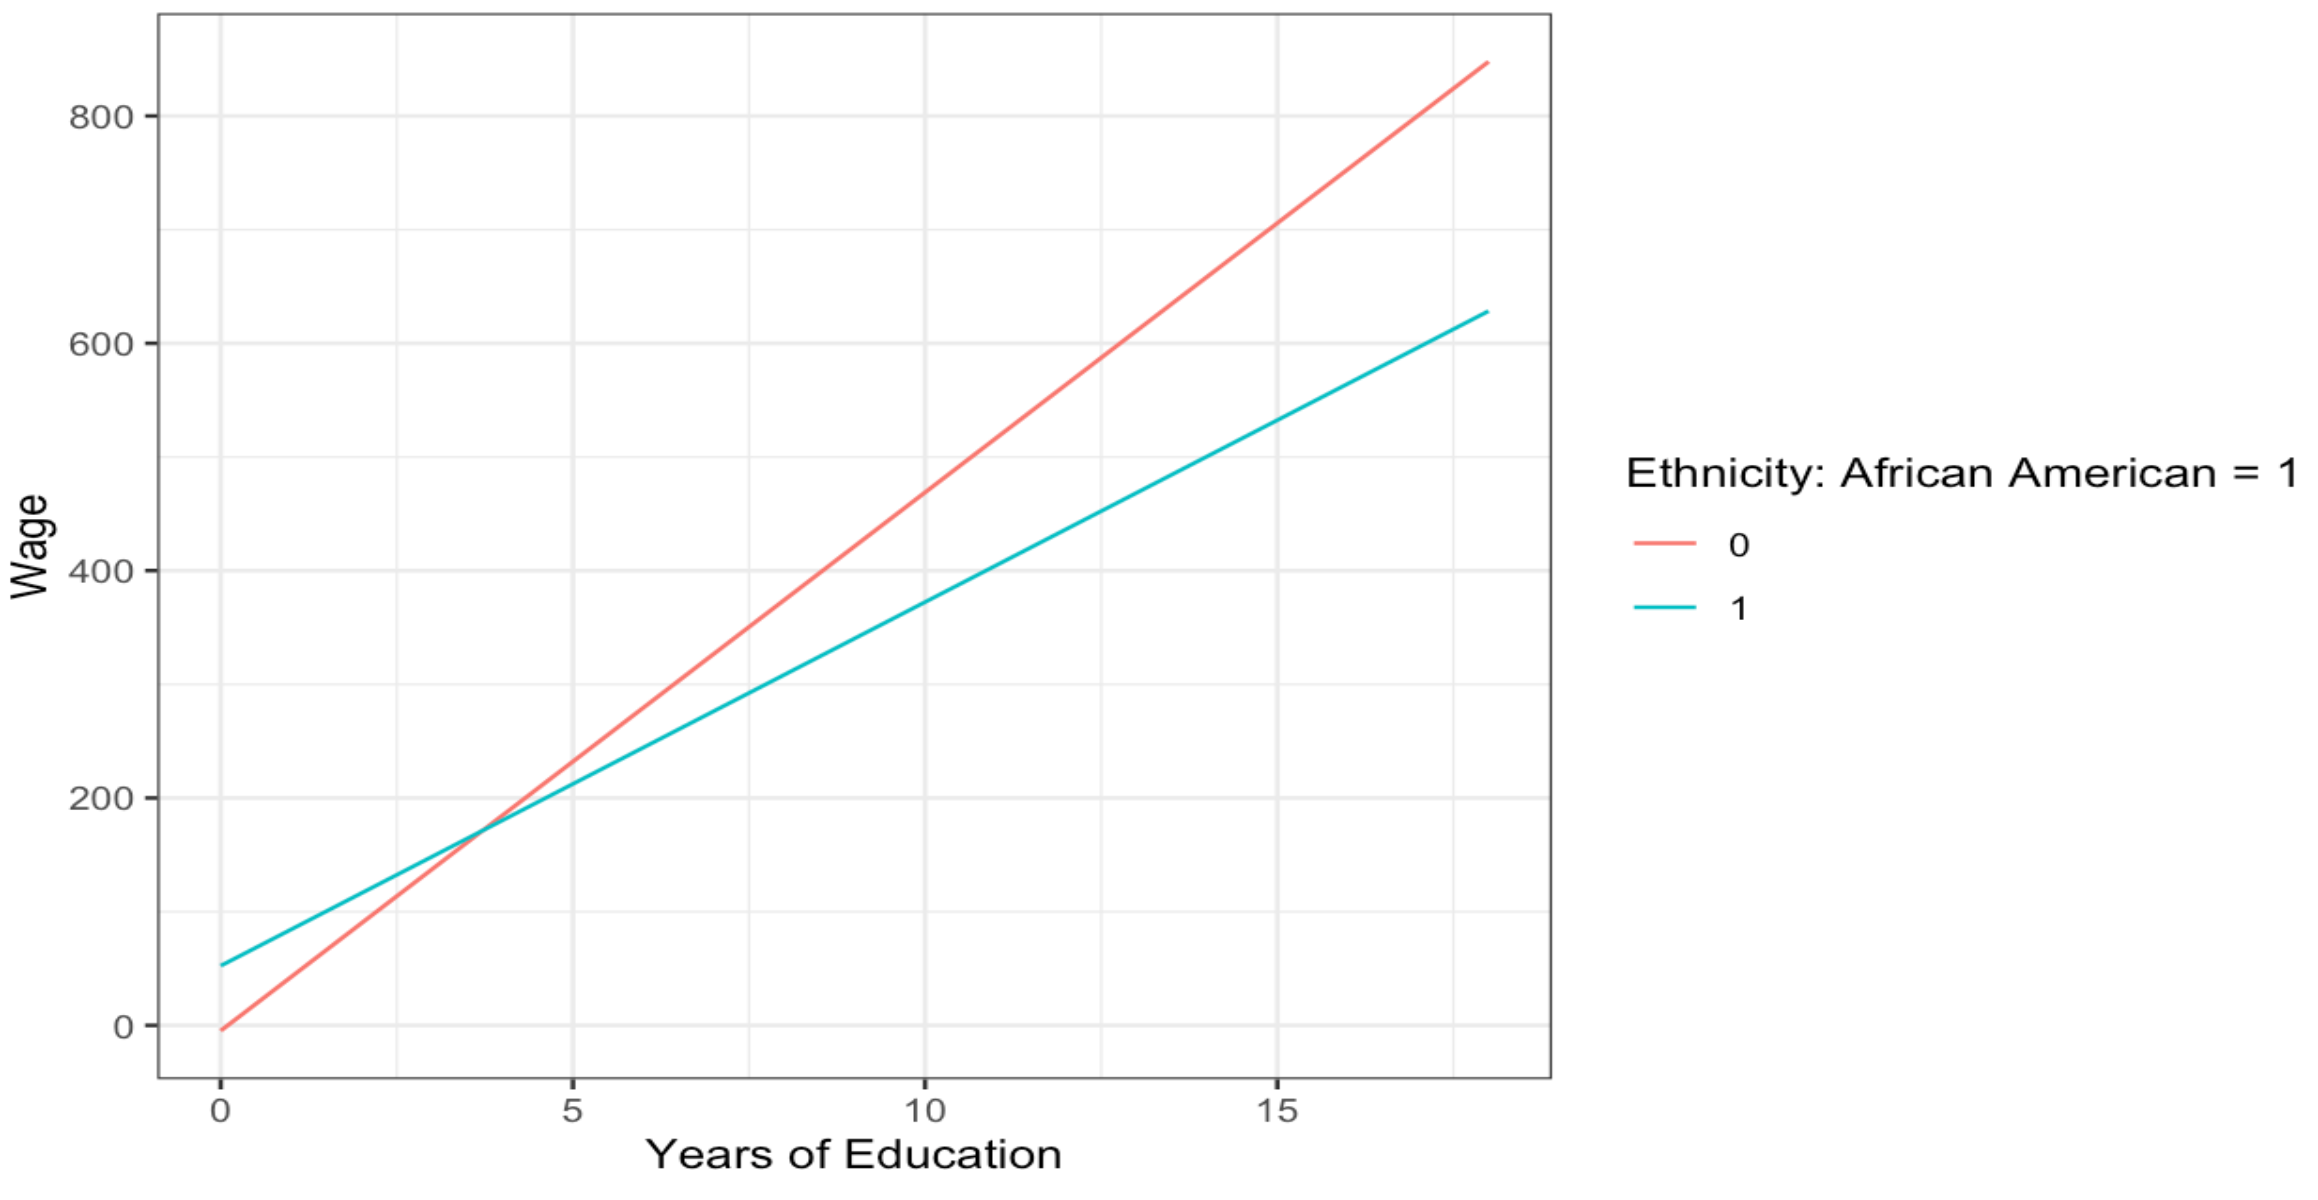
To make ggpredict work, the model to be predicted is specified. Next, the ‘terms’ argument identifies the variables, the so-called focal terms from the model for which predictions will be displayed. The command estimates the model, shows the predicted outcome based on the first focal term, and incorporates interactions by adding a ‘colour=group’ specification.
2. Discrete Multilevel Independent variable without controls
The independent variable doesn’t have to be binary (0 or 1); it can also be multilevel, taking on various values or categories. For example, it could represent different levels of education, such as primary school, secondary school, or tertiary school.
To implement this kind of multilevel variable in R, it’s essential to inform R that you’re working with a factorial or categorical variable with distinct levels. Additionally, you should specify which level will serve as the reference or baseline group, against which the relationships with other levels will be compared.
In the case of a binary variable, like the one displayed above, the reference group is often the 0 value, and the regression output will provide information about the differences in relationships compared to this baseline group.
# Create a discrete multilevel independent variable "region"
CPS1988$region <- factor(CPS1988$region)
CPS1988$region <- relevel(CPS1988$region, ref = "south")
Here, we’re studying a model that tries to understand how a person’s wage (Y) is affected by their level of education (X). We’re also looking into whether a person’s living region (Z) plays a role in moderating or influencing this relationship. Notice that a person’s region is a categorical variable, separating the data into different groups.
# Regression
reg2 <- lm(log(wage) ~ education * region, data = CPS1988)

# Model output
titlereg2 <- 'Table 2: Discrete Multilevel Independent Variable Model without controls'

msummary(reg2,
         fmt = 4,
         stars  = c('*' = .1,
                    '**' = 0.05,
                    '***' = .01),
         estimate = "{estimate}",
         statistic = "[{std.error}]{stars}",
         gof_omit = 'AIC|BIC|RMSE|Within|FE',
         gof_map = gm,
         title = titlereg2,
         notes = notes)
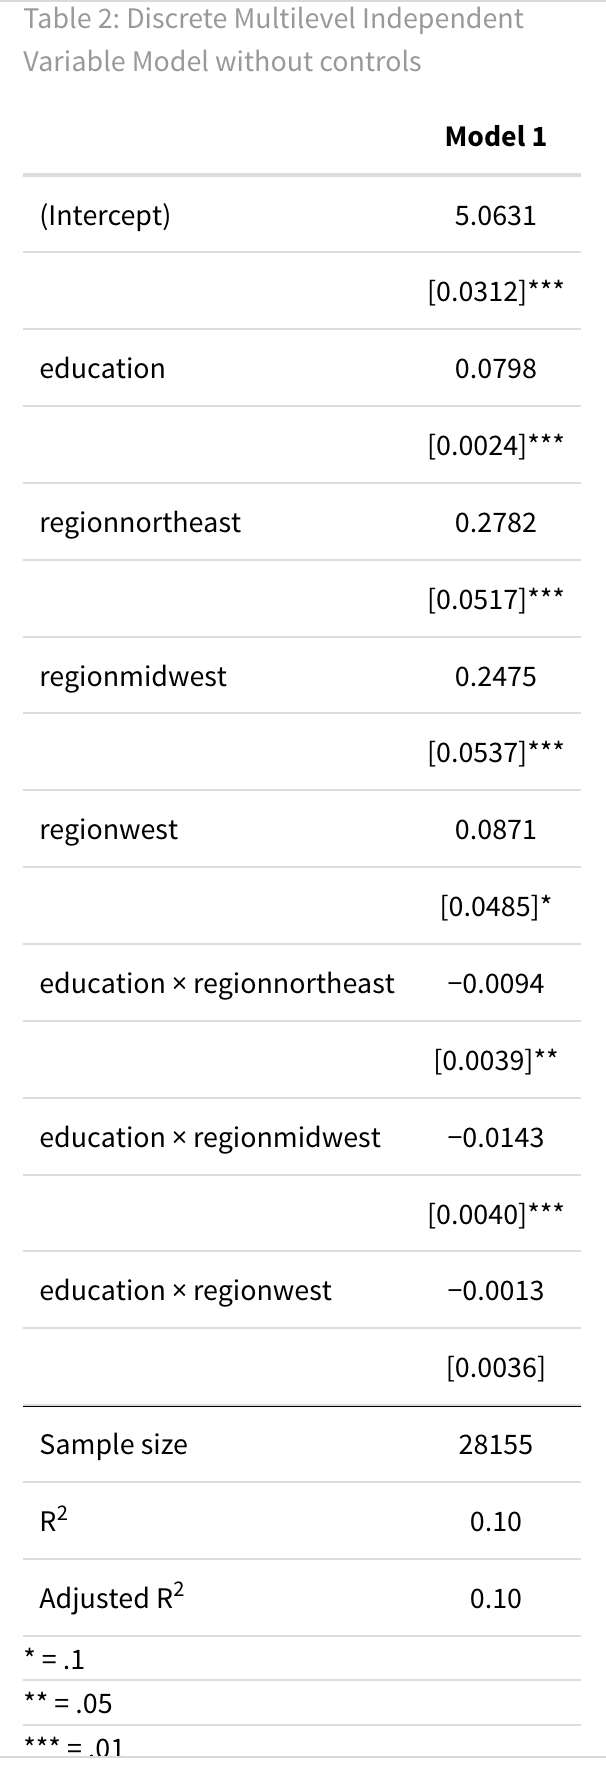
The interpretation of the regression output is as follows, notice that we transformed the wage into a logarithmic scale. For how to interpret a Log-Linear model, see this topic.
Based on this specific dataset and model, we observe that a one-year increase in education is associated with an expected wage increase of 7.98% ($\beta_1$ * 100%), at a 1 per cent significance level.
However, it’s important to note that this relationship is influenced by a person’s region, look at the significance level of the interaction term of the north-east and mid-west. We observe different conditional average treatment effects for each region:
- The estimated average treatment effect for individuals from the South is 8.00% ($\beta_1$).
- For individuals from the North-East, the estimated average treatment effect is 7.04% (0.0798 - 0.0094).
- Individuals from the Mid-West have an estimated average treatment effect of 6.55% (0.0798 - 0.0143).
- In the case of individuals from the West, the estimated average treatment effect is 7.85% (0.0798 - 0.0013), and it’s not statistically significant at the 5% level, indicating no significant difference in the relationship between education and wage from people in the south and the west.
3. Continuous Independent Variable
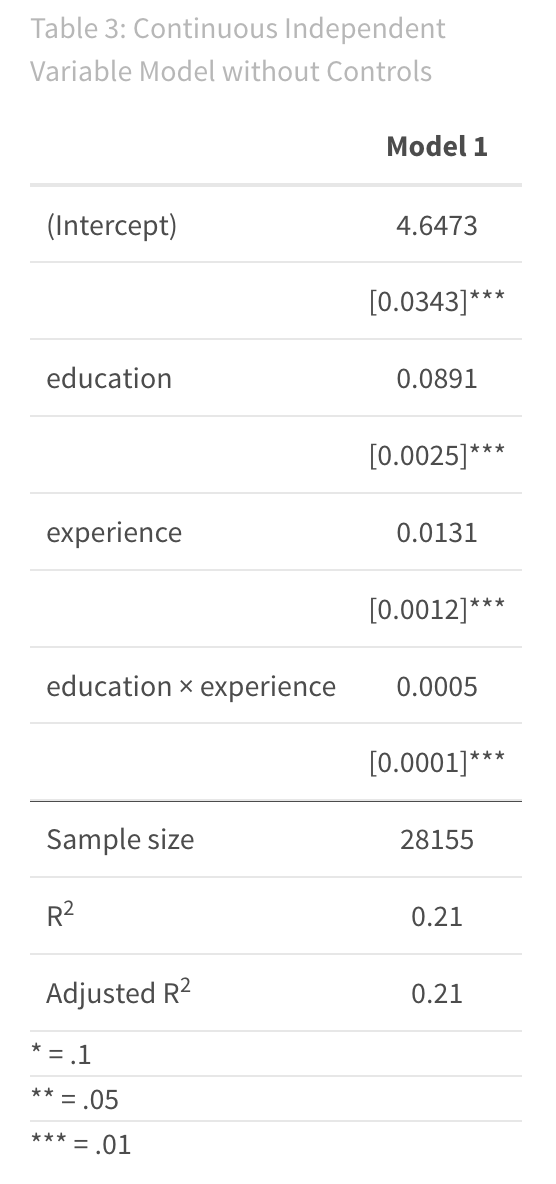
Here, we’re studying a model that tries to understand how a person’s wage (Y) is affected by their level of education (X). We’re also looking into whether being a more experienced worker (Z) plays a role in moderating or influencing this relationship.
In addition, I introduce a new function that allows us to display a marginal effect plot. This time I will use the function interflex. Interflex first estimates a model and then displays the marginal effect plot. Where ggpredict shows us predicted values for different groups, interflex shows marginal effects at each variable X on Y given Z.
# Regression
reg3 <- lm(log(wage) ~ education*experience, data = CPS1988)

# Model Output
titlereg3 <- 'Table 3: Continuous Independent Variable Model with controls'
msummary(reg3,
         fmt = 4,
         stars  = c('*' = .1,
                    '**' = 0.05,
                    '***' = .01),
         estimate = "{estimate}",
         statistic = "[{std.error}]{stars}",
         gof_omit = 'AIC|BIC|RMSE|Within|FE',
         gof_map = gm,
         title = titlereg3,
         notes = notes)

# Marginal Effect Plot
marginal_effect_plot <- interflex(Y = "wage", D = "education", X = "experience" , data = CPS1988, estimator = "binning", bin.labs = T,  wald = TRUE)
plot(marginal_effect_plot)

# Wald Test
print(marginal_effect_plot$tests$p.wald)
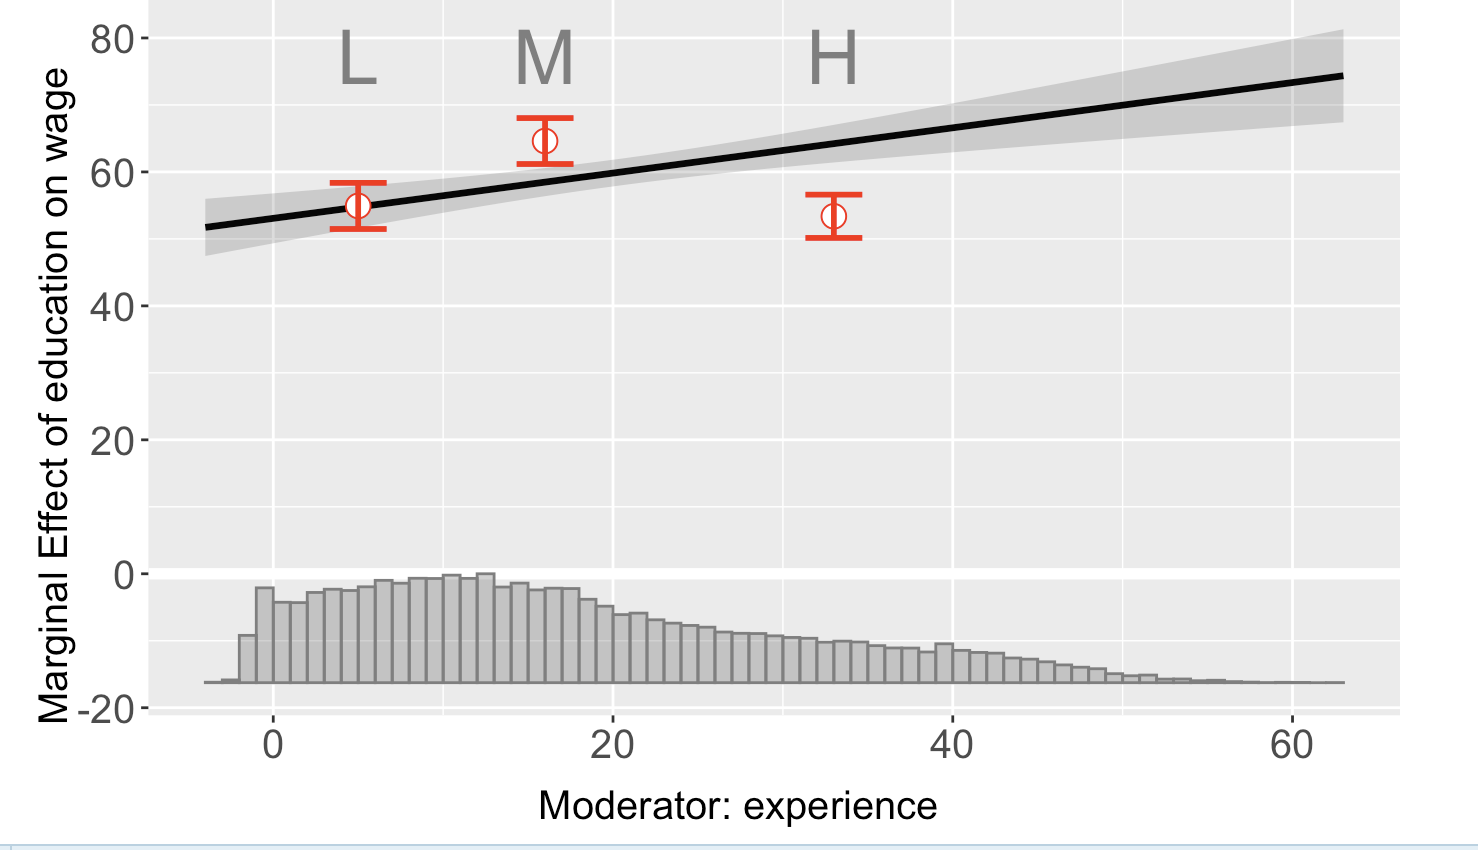
I utilized a linear estimator. Y represents the outcome variable, D represents the treatment variable, X stands for the moderator (our interaction variable), and Z represents the covariates in the model.
Furthermore, interflex provides the option for fixed effects and clustering of standard errors. It’s important to note that the model also displays the confidence interval and the distribution of the moderating variable. In this case, the moderating variable is binary, as expected.
The marginal effect plot can provide valuable insights into the model’s accuracy By using the “binning” argument in the estimator, we break down the interaction term into groups and calculate the interaction effect for each group. This reveals that the relationship seems to be non-linear. The marginal effect plot offers additional information that isn’t available from the summary of the regression alone.
To confirm the significance, you can use the Wald test within the interflex function. The Wald test compares the linear interaction model to the more flexible binning model. The null hypothesis is that the linear interaction model and the three-bin model are statistically equivalent. If the p-value of the Wald test is close to zero, you can confidently reject the null hypothesis. For our example, this is the case!
4. Discrete Dependent Variable
When dealing with a discrete dependent variable like a count or binary variable (0 or 1), you can still calculate and interpret the effects of interaction terms. However, the approach for estimating and interpreting these effects may vary depending on the type of dependent variable. Let’s explore how to compute the effects of interaction terms for binary dependent variables, as seen in logistic regression.
In this scenario, we are analyzing a logistic regression model that aims to determine whether a person’s African American background (Y) can be predicted based on their wage (X). Additionally, we are investigating whether a person’s residence in a metropolitan area moderates this relationship. We will run our logistic regression using glm with family=binomial.
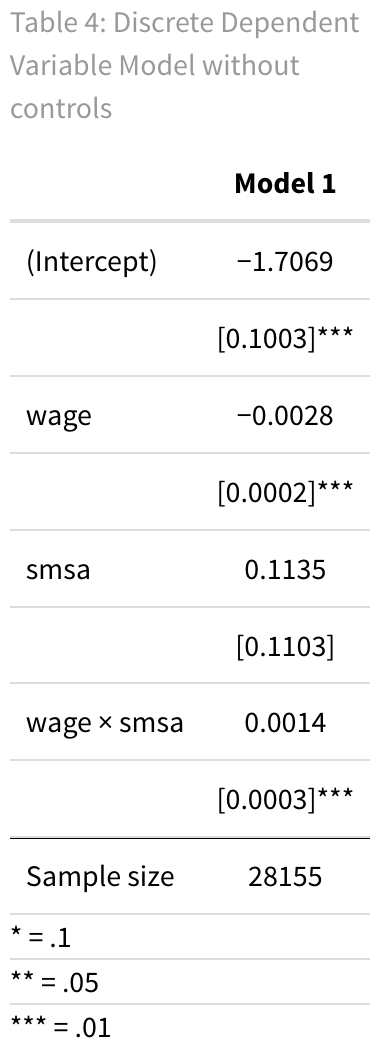
In our output, coefficients are initially in log odds. Think of log odds as a way to measure the odds of an event happening using natural logarithms, allowing for a linear connection with predictors. To draw meaningful conclusions, we often prefer odds ratios. These help us understand how much more or less likely an event becomes when one variable changes versus staying the same. In logistic regression, odds ratios are essential. They quantify how a one-unit change in a predictor impacts the odds of our outcome variable falling into a specific category, making our statistical findings more practical.
log_odds <- coef(reg5)
exp(log_odds)
(exp(log_odds)[4]-1) * IQR(CPS1988$wage) #Coefficient of interaction terms multiplied by the IQR range of gap of the wage distribution

For an individual not residing in a metropolitan area, each one-unit increase in wage is associated with an expected decrease in the odds of being an African American by approximately 0.27463%. However, living in a metropolitan area raises the odds of 0.14% for a unit increase in wage. What does this mean in practical terms? Let’s consider a person at the 75th percentile of the wage distribution. If this individual lives in a metropolitan area, they are approximately 8.59% more likely to be African American compared to if they did not live in a metropolitan area.
5. Continuous Dependent Variable with controls
Let’s examine a full regression model where we aim to explain wages (transformed logarithmically). We include several predictor variables: experience, experience squared (to account for diminishing returns), education, part-time status, ethnicity, metropolitan area, and region.
Additionally, we want to explore if higher education can help narrow the wage gap for African Americans. Specifically, we’re interested in whether the impact of being African American on wages is less pronounced for individuals with higher levels of education.
# Regression
CPS1988$experience2 <- CPS1988$experience^2 # Create a new quadratic variable
reg6 <- lm(log(wage) ~ education * ethnicity + experience +  experience2  + region +  smsa + parttime, data = CPS1988)

# Model Output
titlereg5 <- 'Table 5: Continuous Dependent Variable with controls (Fully Interacted Model)'
msummary(reg5,
         fmt = 4,
         stars  = c('*' = .1,
                    '**' = 0.05,
                    '***' = .01),
         estimate = "{estimate}",
         statistic = "[{std.error}]{stars}",
         gof_omit = 'AIC|BIC|RMSE|Within|FE',
         gof_map = gm,
         title = titlereg5,
         notes = notes)

# Marginal effect plot
marginal_effect_plot <- interflex(Y = "wage", D = "ethnicity", X = "education", Z = c("experience2", "smsa","parttime","region"),
data = CPS1988, estimator = "linear")
plot(marginal_effect_plot)

# Using ggpredict
plot2 <- ggpredict(model = reg5, terms = c("education", "ethnicity"))
ggplot(plot1, aes(x, predicted, colour = group)) +
  geom_line() +
  labs(x= "Years of Education",
       y = "Wage",
       colour = "Ethnicity: African American = 1")

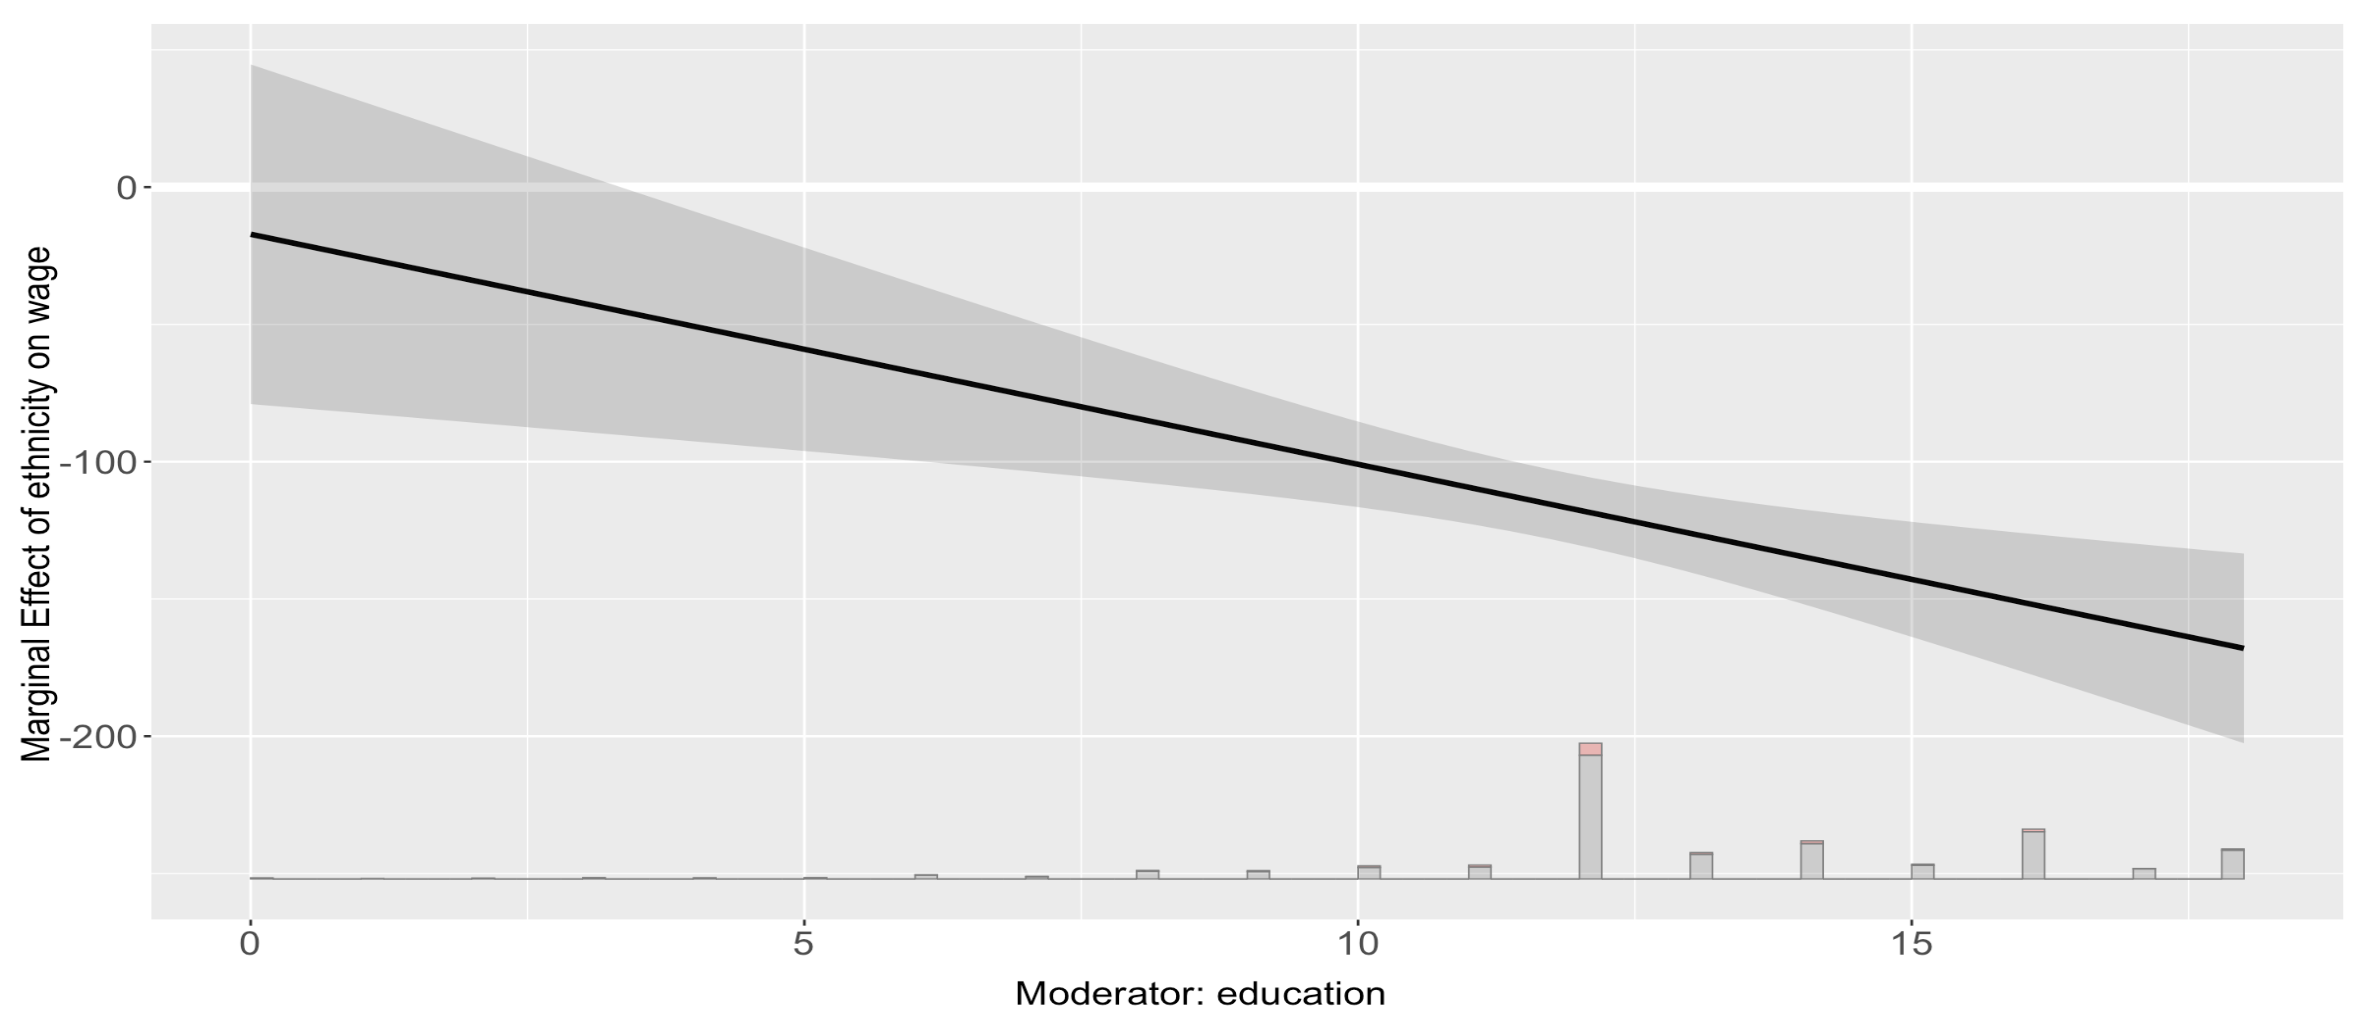
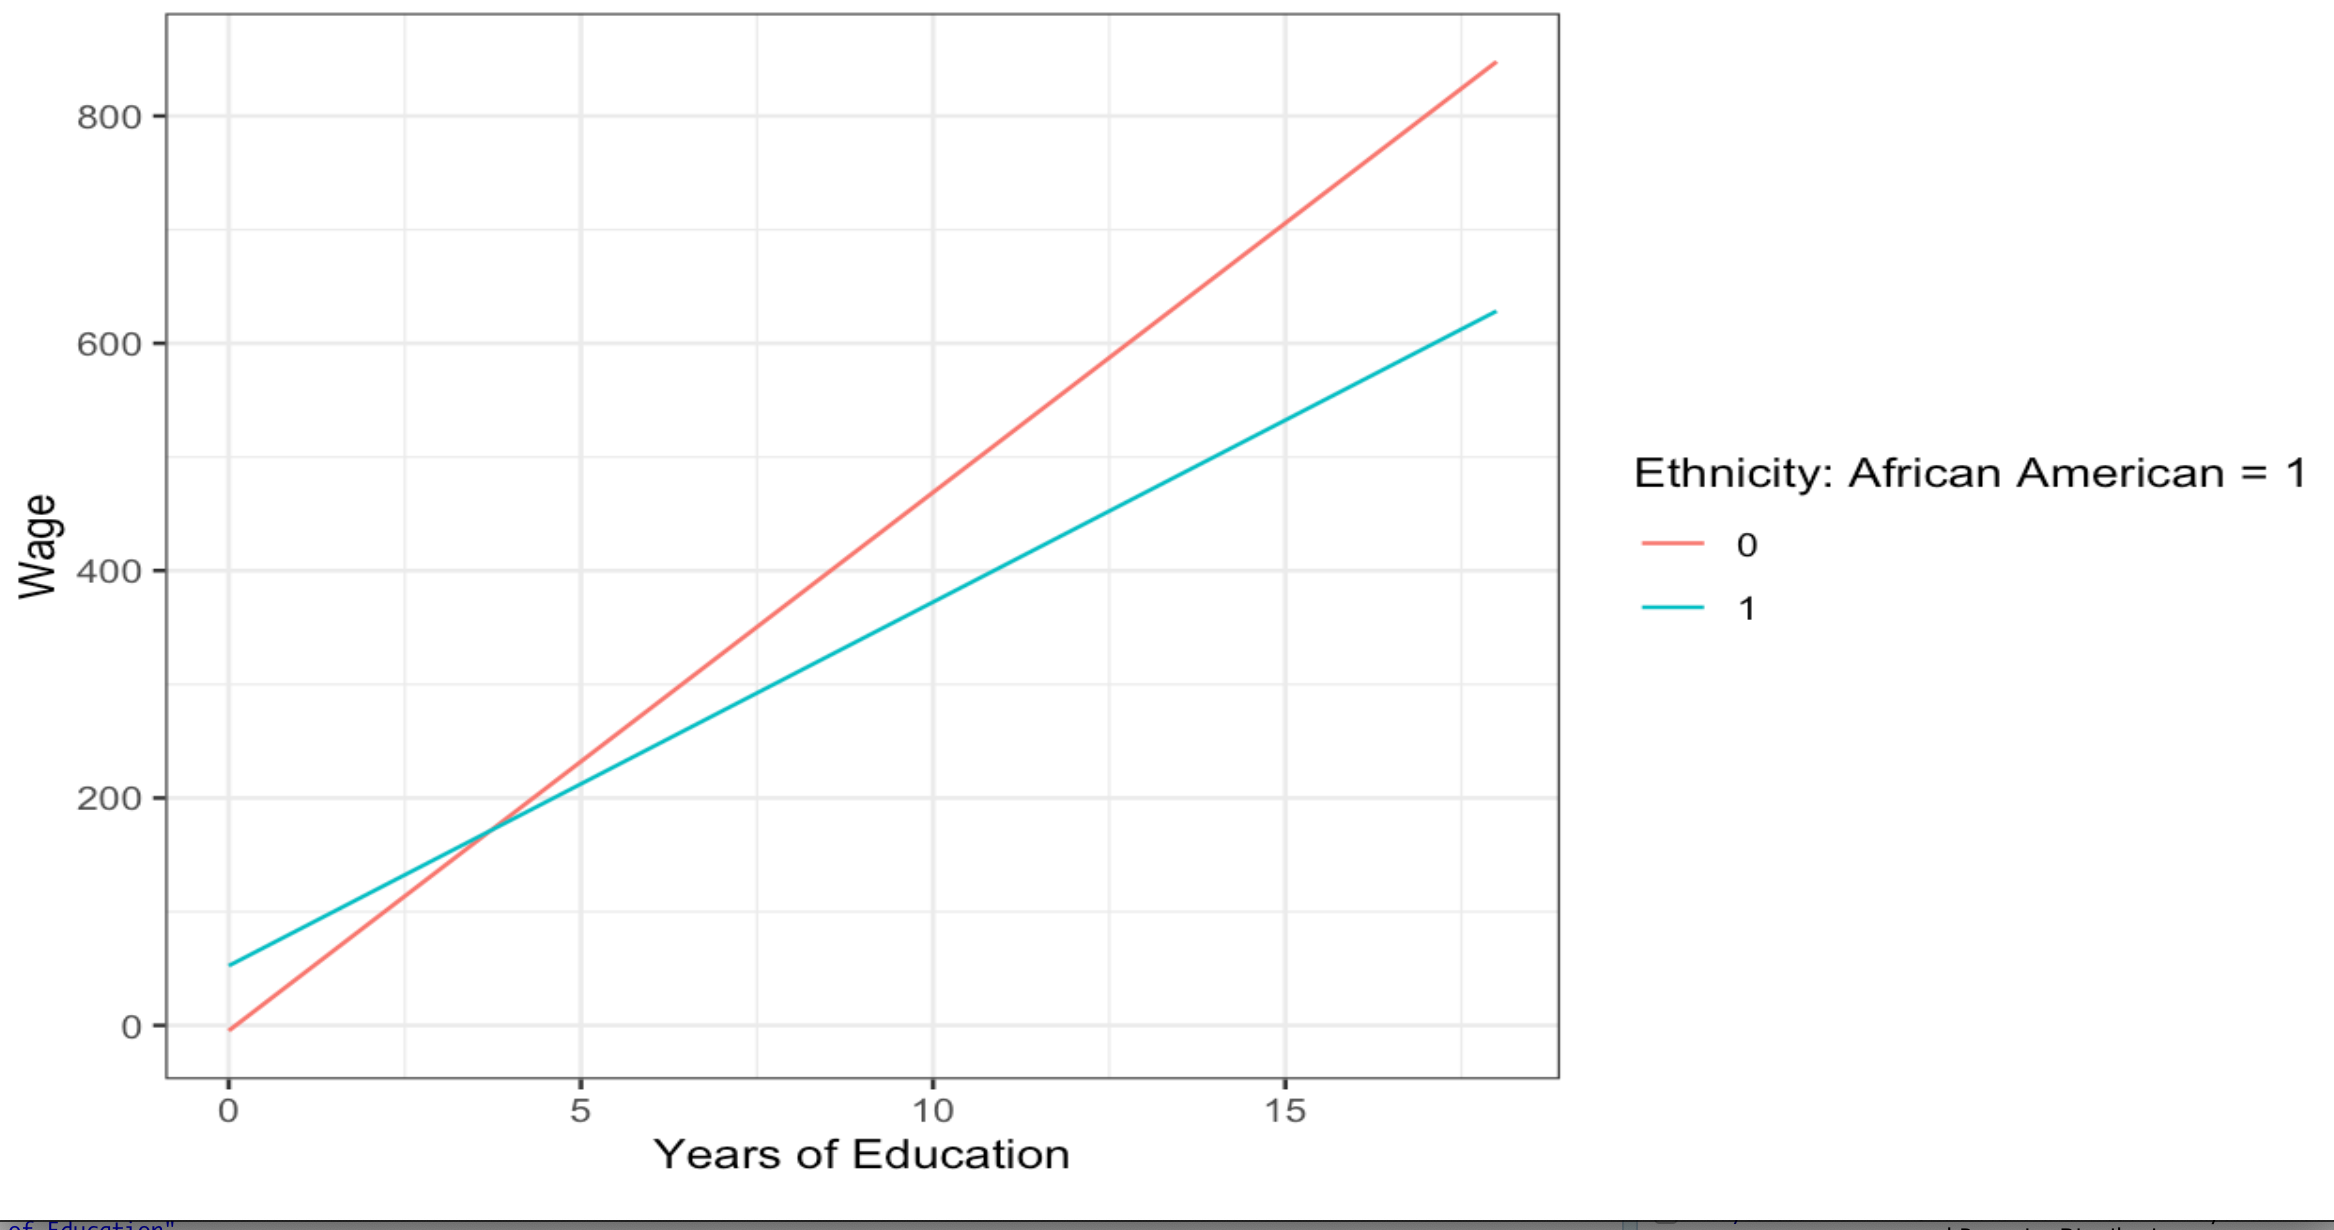
The p-value associated with the interaction term coefficient is 0.0254, thereby indicating statistical significance at the 5% significance level. This provides strong evidence to suggest that an interaction exists between education and ethnicity. However, determining statistical significance is only one part of the equation; it’s also necessary to assess the explanatory significance of this interaction.
summary(reg5)$r.squared
reg6 <- lm(log(wage) ~ education + ethnicity + experience +  experience2  + region +  smsa + parttime, data = CPS1988)
summary(reg6)$r.squared

When examining the variance explained by R-squared, the model without the interaction term accounts for 45.72% of the wage variance, while the model incorporating the interaction term explains 45.73%. This indicates a marginal increase of 0.01% in explained variance. While this may appear to suggest that the interaction has a negligible explanatory impact, it’s worth noting that a small change in R-squared doesn’t necessarily equate to a lack of practical significance. Further research and contextual factors should also be considered to fully understand the implications of this interaction.
Summary
 Summary
This topic explains interaction terms in regression analysis, their mathematical interpretation, and their practical applications in various scenarios. The key points covered include:
-
Interaction Term Introduction: Interaction terms add complexity to the relationship between an
independent variable(X) and adependent variable(Y) by considering how this relationship changes based on the value of another variable (Z). -
Scenario Analysis: The article explores different scenarios involving
continuousanddiscreteindependent and dependent variables. It covers models with and without control variables and examines interactions inbinaryandmulti-levelcontexts. -
Significance and Relevance: The article emphasizes the importance of assessing both the
statistical significanceandexplanatory significanceof interaction terms. -
Importance of visualization: Always make a visualization of your analyses, as it will deepen your knowledge about the relationship. A good standard practice, is to create a
marginal effect plot.


