Overview
In this article, you learn how to fuse data visualization with storytelling. This integration is based on Hans Rosling’s approach to data presentation. Hans Rosling, renowned for his contributions to the Gapminder project, has had a profound impact on how we interpret complex global data in areas such as health, economics, and education. His method of dynamic visual storytelling has challenged and reshaped many long-standing misconceptions.
We delve into the capabilities of the plotly package in R, aiming to mirror Rosling’s engaging narrative style into data visualizations. We start with the basics of the plotly package, highlighting its ability to transform static charts into interactive charts, complete with hover details, zoom capabilities, and adjustable scales. As we delve deeper, we’ll showcase how a combination of plotly‘and ggplot2 transforms conventional data visualizations into interactive, dynamic experiences.
Setup
To begin our exploration of dynamic data storytelling in R, we will set up our environment with plotly and the gapminder dataset. This dataset, the one Rosling used, includes data on GDP, life expectancy, and population across various countries and years, making it well-suited for dynamic storytelling and analysis.
# Install and Load Plotly
install.packages("plotly")
library(plotly)

# Install and Load the Gapminder Dataset
install.packages("gapminder")
library(gapminder)
gapminder_data <- gapminder::gapminder
The Basics of Plotly
Your First Interactive Plot with Plotly
To create an interactive plot with plotly, it’s important to understand the syntax and the role of each component in the final visualization. Let’s walk through this process step by step:
- The
plotlyFunction:
Start with plot_ly(), the primary function in plotly for R. This function initializes a plotly graph.
- Data and Aesthetics:
The first argument in plot_ly() should be the data frame containing your dataset. Following that, define the x and y aesthetics with a tilde (~) before each variable. This notation specifies that these are variables from your dataset and determines which variables are plotted on the x and y axes.
- Plot Type and Mode:
Type Argument: This specifies the kind of plot you’re creating. Options include ‘scatter’ for scatter plots, ‘bar’ for bar charts, or ‘heatmap’ for heatmaps.
Mode Argument: This determines the presentation style of your data points, with choices like ‘markers’ for dots, ‘lines’ for line graphs, or combinations such as ‘markers+lines’.
- Interactive Elements with Text:
Text Argument: Use this to add interactive labels to your data points, visible when hovered over.
Customizing Label Display: You can format these labels with combinations of text, such as text = ~paste("Country:", country, "GDP:", gdp).
Hover Information Control: The hoverinfo attribute, set as e.g. ‘text+x+y’, allows you to decide what information shows up in the tooltips.
- Layers and Traces:
Plotly visualizations consist of “traces”, like lines, bars, markers, etc.
Add these elements using functions like add_lines(), add_bars(), add_markers(), etc.
- Layout and Styling for the Final Touch:
Finally, the layout() function is used for detailed customization. Here, you can add titles, axis labels, legends, and apply various stylistic elements to the plot.
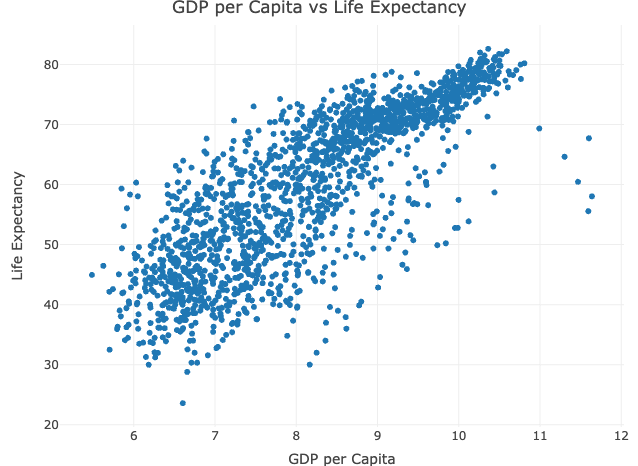
Here’s the complete code for our basis plot:
# Create an interactive scatter plot
plot <- plot_ly(data = gapminder_data,
                x = ~log(gdpPercap),
                y = ~lifeExp,
                type = 'scatter',
                mode = 'markers',
                text = ~country, hoverinfo = 'text+x+y') %>%
        layout(title = 'GDP per Capita vs Life Expectancy',
               xaxis = list(title = 'GDP per Capita'),
               yaxis = list(title = 'Life Expectancy'))
 Tip
TipUnderstanding Plotly’s Interactivity
While the screenshots included serve as a helpful visual reference, they don’t fully convey the interactive capabilities of plotly’s plots. The best way to understand these dynamic elements is to run the example code in your R environment. Engaging with the plots directly through your R setup will provide a more comprehensive understanding of plotly’s interactive capabilities.
The Interactvity capabilites of Plotly
When you run the provided code in your R environment, you’ll be presented with an interactive scatter plot in the viewer pane. This plot allows you to interact with the data points in several ways:
Hover Interactivity
By simply moving your cursor over the markers on the plot, you activate tooltips that reveal detailed information. For instance, in our example, hovering over a point displays the respective country’s name, GDP per capita, and life expectancy.
Zoom and Pan Capabilities
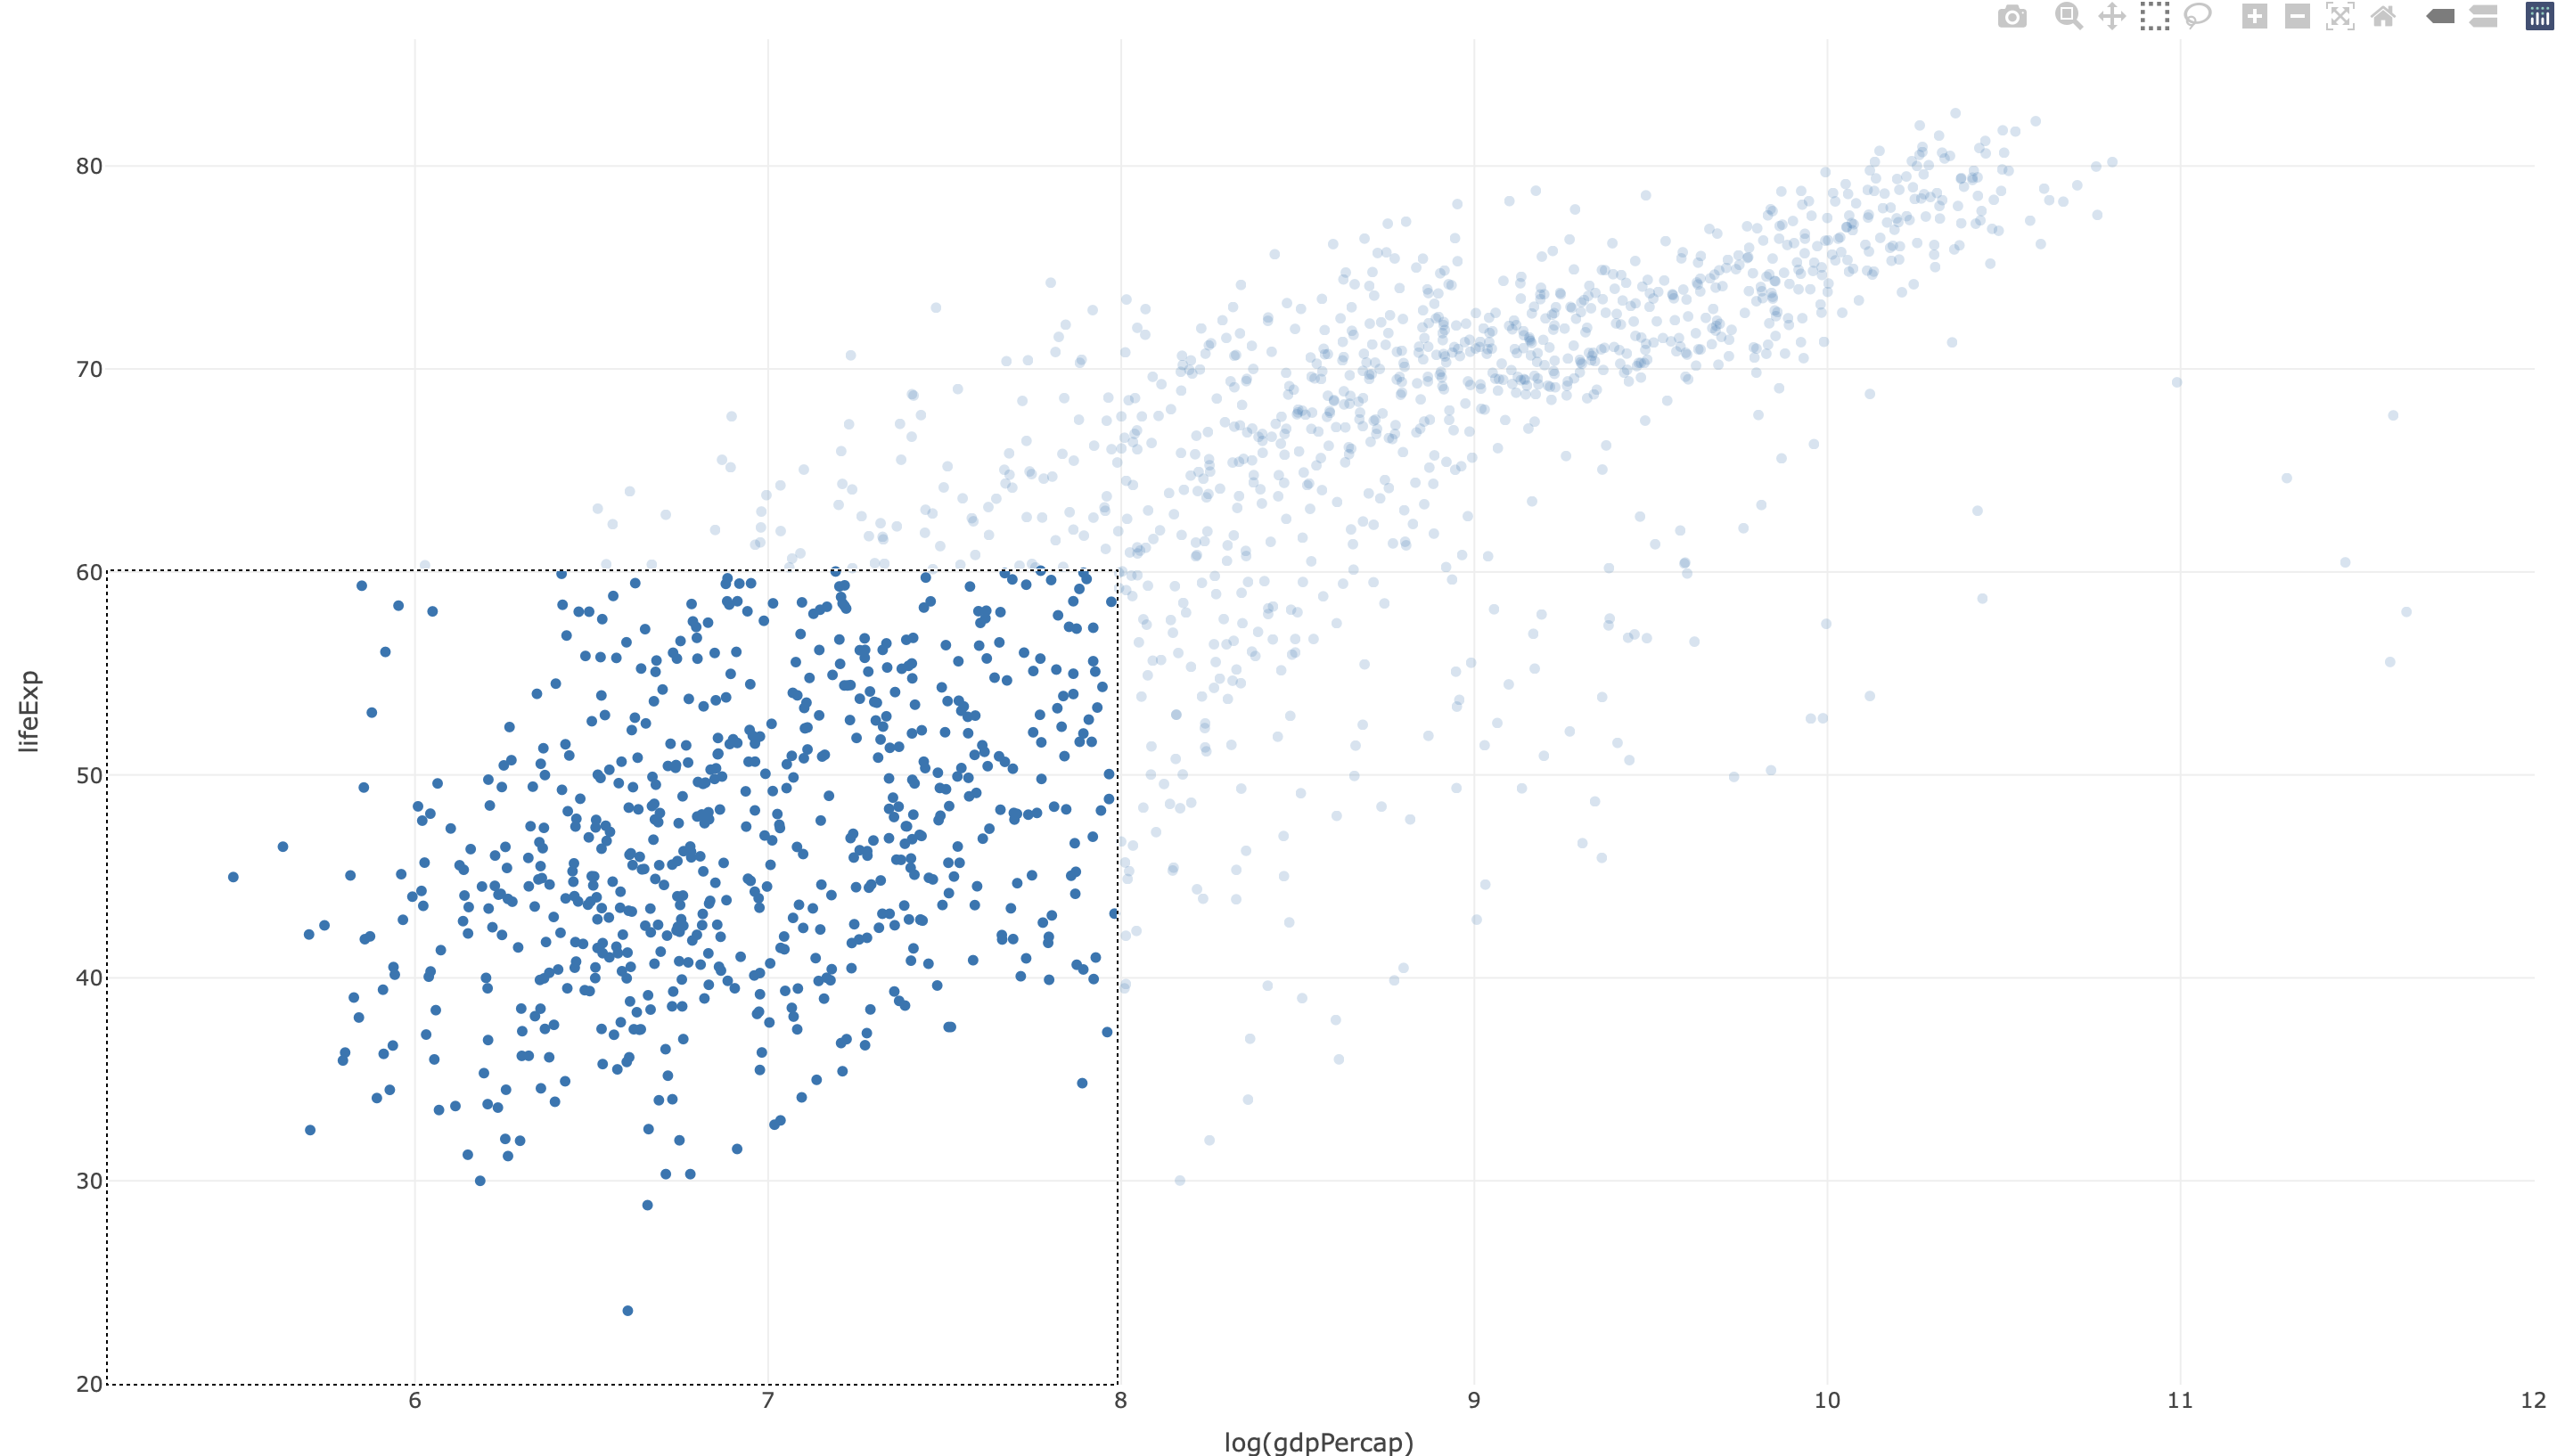
plotly’s zoom functionality is tailored for detailed examination of specific plot areas, especially useful in densely populated regions of the plot or when focusing on certain data ranges. You can activate zooming with a simple scroll or by selecting a specific area within the plot.
 Tip
TipCustomizing Hover Text Boxes
plotly offers the option to customize hover text boxes, enhancing both context and readability. When customizing these text boxes for your visualization, keep these key points in mind:
Conciseness with Relevant Information: Ensure the hover text boxes remain clear and uncluttered. Include only the most crucial data to avoid overwhelming the viewer and to facilitate quick comprehension.
Formatting for Readability: Utilize HTML tags for structured formatting. This approach helps to make complex data more accessible and keeps the hover text boxes organized and clean.
Simplifying Variable Names: For lengthy or complex variable names, consider using shorter, more intuitive aliases to enhance user-friendliness.
# Create an interactive scatter plot
plot <- plot_ly(data = gapminder_data,
                x = ~log(gdpPercap),
                y = ~lifeExp,
                type = 'scatter',
                mode = 'markers',
                text = ~paste("Country:", country,
      # text = ~paste(...): Customizes the hover text.
                              "<br>GDP per Capita:", gdpPercap, # line breaks (<br>) for readability.
                              "<br>Life Expectancy:", lifeExp,
                              "<br>Population:", pop),
                hoverinfo = 'text',) %>%
  layout(title = 'GDP per Capita vs Life Expectancy',
         xaxis = list(title = 'GDP per Capita'),
         yaxis = list(title = 'Life Expectancy'),
         # hoverlabel: Customizes the hover label.
         hoverlabel = list(bgcolor = "white") # Set hover label background to white

Bringing Data to Life with Animations
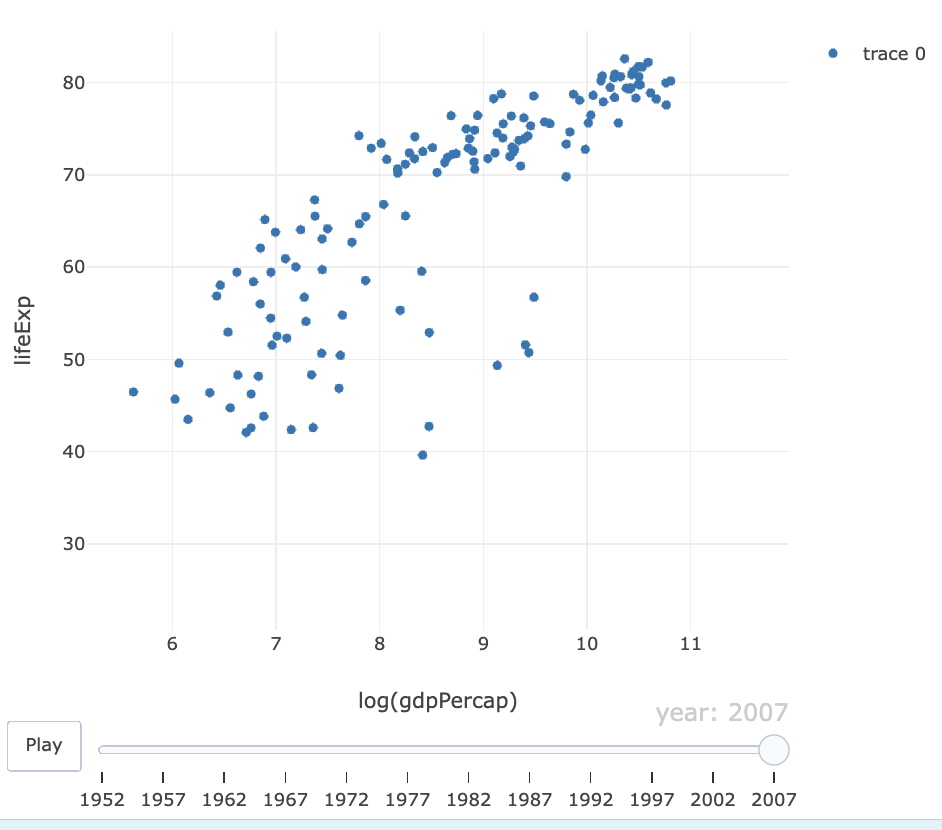
With the basics in place, our plotly scatter plot currently showcases the relationship between GDP and life expectancy through interactive, hoverable points. However, the simultaneous display of data across all years can create a visually cluttered experience. The next step is to add: Animation. plotly’s animation capabilities can transform these static visualizations into dynamic narratives, effectively illustrating changes over time.
Implementing Animations in Plotly
To animate data using plotly, there are two steps to follow:
Step 1: Organizing Data with the Frame Argument
Start with setting frame = ~<category> in the plot_ly() function. where plotly based on the selected category.
Step 2: Fine-Tuning with Animation Options
Next, apply animation_opts(frame = <duration>, redraw = TRUE, transition = <transition_time>, easing = <easing_function>) for detailed control over the animation:
- frame = duration: Determines the duration each frame is displayed, in milliseconds.
- redraw = TRUE: Ensures smooth transitions between frames.
- <transition_time>: Sets the duration of transitions between frames, adding to the animation’s smoothness.
- <easing_function>: Selects the animation style (like linear, elastic, or bounce), which influences the motion and aesthetic feel of the animation.
Here’s an example illustrating how to animate our scatter plot in R using plotly:
# Integrated Example for an Enhanced Animated Scatter Plot
plot_ly(gapminder_data,
        x = ~log(gdpPercap),
        y = ~lifeExp,
        frame = ~year,  # Replace 'year' with your chosen category
        text = ~paste("Country:", country,
                      "<br>GDP per Capita:", gdpPercap,
                      "<br>Life Expectancy:", lifeExp),
        type = 'scatter',
        mode = 'markers',
        hoverinfo = 'text+x+y') %>%
  layout(title = 'GDP per Capita vs Life Expectancy',
         xaxis = list(title = 'GDP per Capita'),
         yaxis = list(title = 'Life Expectancy'),
         hoverlabel = list(bgcolor = "white")) %>%
  animation_opts(frame = 1000,
                 redraw = TRUE,
                 transition = 50,
                 easing = 'elastic')

Running this code results in an animated scatter plot that not only shows the relationship between GDP per capita and life expectancy but also illustrates how these variables have changed over time (or your chosen category). The inclusion of animation features can significantly influence the visualization’s engagement and insightfulness, narrating the story hidden within the numbers.
 Tip
TipCustomizing the Animation
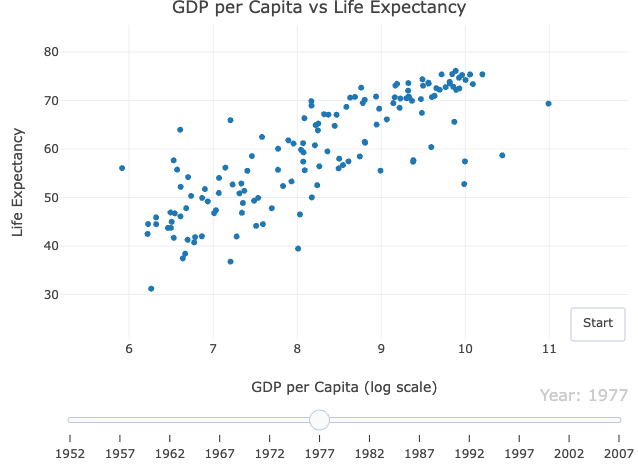
Improve the animated scatter plot in plotly by adding user-friendly interactive elements such as a play button and a slider for improved navigation and control.
# Previous code %>%
  animation_opts(frame = 1000,
                redraw = TRUE,
                transition = 50,
                easing = 'elastic') %>%
  animation_button(x = 1,
                   xanchor = "right",
                   y = 0,
                   yanchor = "bottom") %>%
  animation_slider(currentvalue = list(prefix = "Year: "))
ggplot2 Integration with Plotly
Integrating ggplot2 with plotly in R offers a method to combine the aesthetic capabilities of ggplot2 with the dynamic interactivity of plotly. This synergy is especially beneficial for those familiar with ggplot2, as it allows for the use of its syntax for initial plot customization, followed by the addition of interactive features through plotly.
 Tip
TipData Visualization With ggplot2
For a deeper understanding of ggplot2’s principles, consider exploring the “Grammar of Graphics”. This concept, which is at the core of ggplot2 is discussed in the following article.
Why Merge ggplot2 with Plotly?
- Visual Appeal of
ggplot2:
Known for creating clean and visually appealing plots, ggplot2 offers extensive customization options, catering to a wide range of visualization needs.
- Interactive Enhancement with Plotly:
By integrating ggplot2 plots with plotly, you add an interactive dimension to your visualizations. Features such as tooltips, zooming, and panning significantly improve user engagement and understanding.
- Leveraging Familiar Syntax for Enhanced Flexibility:
For those proficient in ggplot2, combining it with plotly means you can start with the familiar ggplot2 syntax for initial customization and then bring in plotly’s interactivity.
The merger of ggplot2 and plotly effectively brings together the best of both worlds, providing a comprehensive toolkit for data storytelling.
Implementing ggplot2 and Plotly Integration
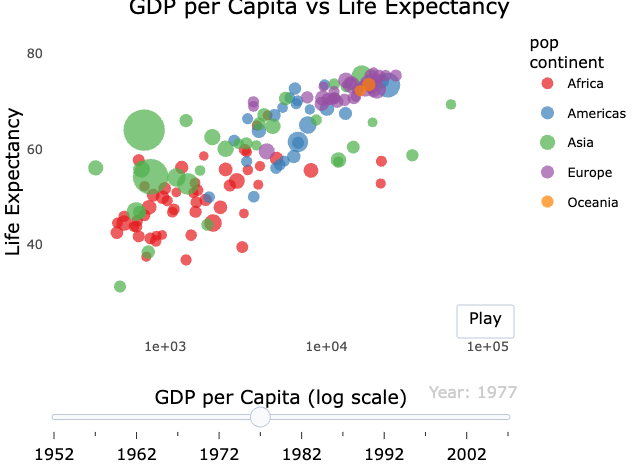
The process of integrating ggplot2’s design elements with plotly’s interactive capabilities involves creating a plot with ggplot2 and then transforming it into an interactive plotly chart. Such an approach ensures that your final visualization not only retains the aesthetic appeal of ggplot2 but also benefits from the dynamic interactivity of plotly.
# Step 1: Creating and Customizing a ggplot2 Scatter Plot
# Utilize ggplot2's syntax for detailed customization
gg_base_plot <- ggplot(gapminder_data, aes(x = gdpPercap, y = lifeExp, color = continent, size = pop)) +
                geom_point() +  # Adding points
                scale_x_log10() +  # Logarithmic scale for x-axis
                labs(title = "Global Development", x = "GDP per Capita", y = "Life Expectancy") +  # Custom labels
                theme_minimal()  # Minimalist theme for clarity

# Step 2: Converting to an Interactive Plotly Chart
# Transform the customized ggplot into an interactive Plotly object
plotly_interactive <- ggplotly(gg_base_plot)
Bundling it all together
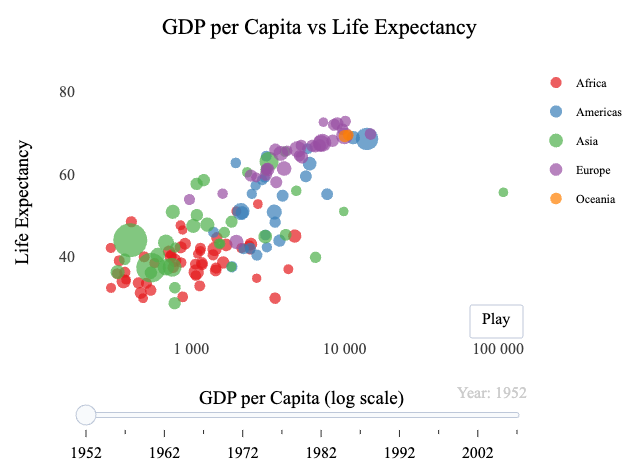
To fully leverage the strengths of both ggplot2 and plotly, the following code demonstrates how to integrate a detailed ggplot2 scatter plot with the interactive functionalities of plotly. This combination allows for a dynamic and insightful presentation of your data.
# Load necessary libraries
library(ggplot2)
library(plotly)
library(dplyr)
library(gapminder)

# Load Gapminder data
data(gapminder)

# Step 1: Create a Customized ggplot2 Scatter Plot
gg_scatter_plot <- ggplot(gapminder,
                          aes(x = gdpPercap,
                              y = lifeExp,
                              color = continent)) +
  # Adding points with adjusted sizes based on population
  geom_point(aes(size = pop,
                 frame = year,
                 ids = country,
                 text = paste("Country:", country,
                              "<br>GDP per Capita:", round(gdpPercap, 2),
                              "<br>Life Expectancy:", round(lifeExp,1))),
             alpha = 0.7) +
  # Adjusting point sizes for better visualization
  scale_size(range = c(2, 12)) +
  # Using logarithmic scale for x-axis (GDP per Capita)
  scale_x_log10(labels = scales::label_number()) +
  # Utilizing a minimalist theme for a clean look
  theme_minimal(base_size = 12) +
  # Applying a distinct color palette
  scale_color_brewer(palette = "Set1") +
  # Customizing various theme aspects for aesthetics
  theme(
    text = element_text(family = "Times New Roman"), # Set global font family
    legend.title = element_blank(),
    legend.position = "top",
    plot.title = element_text(face = "bold", size = 14),
    plot.subtitle = element_text(face = "italic", size = 12),
    plot.caption = element_text(face = "italic", size = 10),
    panel.grid.major = element_blank(),
    panel.grid.minor = element_blank(),
    axis.text.x = element_text(color = "grey24", size = 12),
    axis.text.y = element_text(color = "grey24", size = 12),
    axis.title = element_text(face = "bold", color = "grey24", size = 14),
    axis.ticks = element_blank(),
    plot.margin = margin(1, 1, 1, 1, "cm"))

# Convert ggplot to an interactive Plotly plot
plotly_interactive <- ggplotly(gg_scatter_plot, tooltip = c("text")) %>%
  # Setting animation options for smooth transitions
  animation_opts(frame = 1000, easing = "elastic", redraw = TRUE) %>%
  # Adding a play/pause animation button
  animation_button(x = 1, xanchor = "right", y = 0, yanchor = "bottom") %>%
  # Adding a slider for navigating through years
  animation_slider(currentvalue = list(prefix = "Year: ")) %>%
  # Customizing layout and hover label for readability
  layout(title = "GDP per Capita vs Life Expectancy",
         xaxis = list(title = "GDP per Capita (log scale)", font = list(family = "Times New Roman")),
         yaxis = list(title = "Life Expectancy", font = list(family = "Times New Roman")),
         legend = list(title = "Continent",font = list(family = "Times New Roman", size = 12)),
         hoverlabel = list(bgcolor = "white", font = list(family = "Times New Roman", size = 12)))

# Display the interactive plot
plotly_interactive
 Tip
TipNessary components
Specifying frame = year and ids = country in the plot is necessary for the following reasons:
frame = year:- Animation Control: The frame attribute determines how the data is segmented for the animation. Without specifying
frame = year,plotlywould not know how to sequence the data over time. - Temporal Sequencing: Specifying year as the frame ensures that the plot’s animation follows a chronological order, essential for visualizing time-series data or trends over time.
- Animation Control: The frame attribute determines how the data is segmented for the animation. Without specifying
ids = country:- Data Point Tracking: The ids attribute provides a unique identifier for each data point. In the absence of
ids = country, Plotly would struggle to track the continuity of a specific data point (i.e., a country) across different frames.
- Data Point Tracking: The ids attribute provides a unique identifier for each data point. In the absence of
Closing Thoughts: the Data Story
Our data visualization, merges the aesthetics of ggplot2 with the interactivity of plotly, has revealed a data story, echoing the work of Hans Rosling:
- Global Trends Unveiled: The animation unveils the evolving landscape of life expectancy and GDP per capita over time
- Insights at Your Mouse: Interactive tooltips empower users with instant insights about each country, simplifying comprehension
- Your Exploration, Your Pace: User-controlled animation, featuring a play option, transforms you from a passive observer to an active explorer, creating a commitment to engaging audiences.
In essence, this visualization isn’t just data; it are data points evolved into narratives.
 Summary
This article explores combining plotly and ggplot2 in R for dynamic data storytelling, inspired by Hans Rosling’s approach. Key elements include:
- Plotly Basics: Setting the function
plot_ly(), by specifying the dataset and aesthetics, customizing plot type, mode, and interactive elements. - Interactivity Features: Explanation of
plotly’s interactive features like hover tooltips and zoom capabilities, along with customization tips for hover text boxes. - Animating Plots: Steps for animating plots in
plotly, usingframefor data categorization andanimation_optsfor detailed control, including frame duration, transition time, and easing functions. - ggplot2 Integration: How to integrate
ggplot2’s design elements withplotly’s interactivity, starting from creating aggplot2plot and then transforming it into an interactiveplotlychart. - Essential Components for Animation: Importance of specifying
frame = yearandids = countryfor temporal sequencing and data point tracking in animations.
The article provides a step by step guide for creating engaging and informative visualizations by merging the aesthetic appeal of ggplot2 with the dynamic interactivity of plotly.


