


Overview
In this building block, we'll explore the convenient use of Stata graphs with the use of the command twoway, which allows you to create a variety of graph types.
By specifying the graph type (e.g., line, scatter) and the relevant variables, you can swiftly create informative visualizations. Let's walk through an example together to illustrate this process.
 Tip
TipFor this illustration, we will use the auto.dta data set provided by Stata.
You can download it using the command 'sysuse "auto.dta"'.
For more information about sample datasets in Stata, refer to this link!
An Example
Various types of plots
Let's start with a basic example of using the twoway command to create various types of plots:

* Load the dataset
sysuse "auto.dta", clear

* Create different types of plots
twoway line price mpg  // line plot
twoway scatter price mpg  // scatter plot
twoway area price mpg   // area plot
twoway bar price mpg   // bar plot
twoway spike price mpg  // spike plot
Further customization
You can further customize these plots with additional features such as axis titles, color schemes, and more.
* Add y-axis title, x-axis title and graph title
twoway line price mpg, ytitle("Price") xtitle("Mileage")

* Change the color and style of the line
twoway line price mpg, ytitle("Price") xtitle("Mileage") lcolor(red) lpattern(dash_dot)

* Make use of the styles provided by Stata
set scheme s1color // this command sets the scheme s1color
twoway line price mpg
*
set scheme Economist // this command sets the scheme s1color
twoway line price mpg
Stata offers a range of style schemes for you to experiment with. Discover more here!
You can also create graphs based on different grouping or conditions. Here's how to do it:
* Creating different lines for different groups
tab foreign // foreign variable equals to 1 if the observation is foreing, zero otherwise
// Create two lines for Domestic and Foreign cars
set scheme s1color // this command sets the scheme s1color
twoway (line price mpg if foreign == 0) (line price mpg if foreign == 1)
// Add a legend to distinguish groups
cap drop Origin
gen Origin = 1 if foreign == 0 // domestic cars
replace Origin = 2 if foreign == 1 // foreign cars
tab Origin
*
twoway (line price mpg if Origin == 1) (line price mpg if Origin == 2), legend(label(1 Domestic) label(2 Foreign))
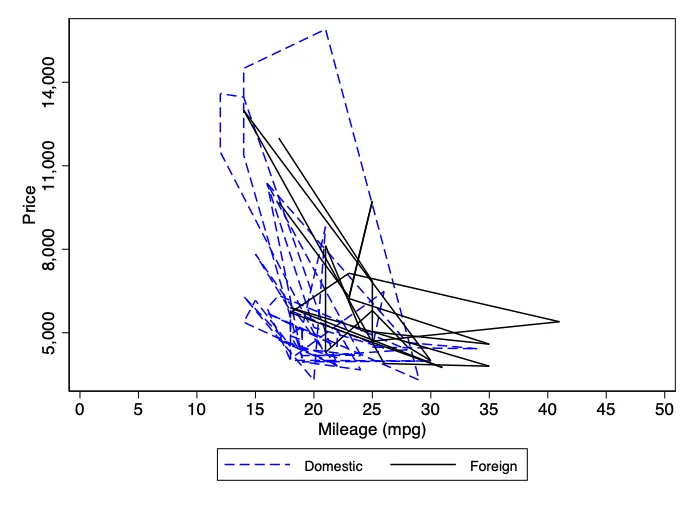
// Customize line style with lcolor and lpattern options
twoway (line price mpg if Origin == 1, lcolor(blue) lpatter(dash)) (line price mpg if Origin == 2, lcolor(black) lpatter(solid)), legend(label(1 Domestic) label(2 Foreign))
// Change the size of the legend
twoway (line price mpg if Origin == 1, lcolor(blue) lpatter(dash)) (line price mpg if Origin == 2, lcolor(black) lpatter(solid)), legend(size(small) label(1 Domestic) label(2 Foreign))
// Adjust axis range
twoway (line price mpg if Origin == 1, lcolor(blue) lpatter(dash)) (line price mpg if Origin == 2, lcolor(black) lpatter(solid)), legend(size(small) label(1 Domestic) label(2 Foreign)) xlab(0(5)50) ylabel(5000(3000)15000)
 Example
The example code above generates a graph based on the auto dataset, showcasing different groupings.
Additional Resources
-
Easy Interactive Tutorial on Styling in Stata
 Summary
Stata empowers you to create customizable graphs effortlessly. Use Stata's style schemes, personalize axes, and even graph variables based on diverse groupings!