


Overview
In the world of data analysis, the ability to communicate insights effectively is a great skill to have.
Shiny is a package that helps you turn your analyses into interactive web applications all with R or Python without requiring HTML, CSS, or Javascript knowledge. Shiny empowers data analysts and scientists to create dynamic, user-friendly applications that allow non-technical stakeholders to explore and interact with data in real time.

Whether you're looking to build an interactive dashboard for tracking key metrics, a tool for exploring complex datasets, or a platform for running simulations and models, Shiny provides a versatile framework that can fulfill a range of use cases.
In this guide, we'll walk you through the fundamental concepts of creating Shiny apps, step by step. By the end, you'll have the skills to transform your static analyses into engaging web applications that empower your audience to conduct their own explorations. So, whether you're a data analyst, a scientist, or anyone who wants to convey insights in an interactive and impactful way, dive into the world of Shiny apps and unlock the potential of dynamic data visualization!
The building block consists of the following sections
- Skeleton
- Layout options
- Define placeholders
- Control widgets
- An example
Skeleton
The skeleton of any Shiny app consists of a user interface (ui) and a server. The ui defines the visual elements, such as plots and widgets, while the server handles the reactive behavior and interactions. This is for example what happens once you click on the download button. And this is exactly where Shiny shines: combining inputs with outputs.

library(shiny)


ui <- fluidPage(
  # Define UI components here
  )

server <- function(input, output){
  # Implement server logic here
}

shinyApp(ui = ui, server = server)
Layout options
Sidebar
A common layout structure in Shiny apps is the sidebar layout. This layout divides the app into a small sidebar panel on the left and a main content panel on the right.
ui <- fluidPage(
  sidebarLayout(
    sidebarPanel(
      "This is the sidebar"
    ),
    mainPanel(
      "Main panel goes here"
    )
  )
)
Tabs
Tabs are another effective way to organize content in your Shiny app. They provide a convenient means of switching between different sections of your app's content.
tabsetPanel(
  tabPanel(title = "tab 1",
    h1("Overview"),
    "Content goes here"),
  tabPanel(title = "tab 2", "The content of the second tab"),
  tabPanel(title = "tab 3", "The content of the third tab")
)
 Example
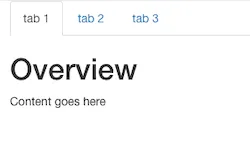
Placeholders
Define a placeholder for plots, tables, and text in the user interface (ui) and server side (server).
- Text can be formatted as headers (e.g.,
h1(),h2()) or printed in bold (strong()) or italics (em()) format. - The
ggplotly()function can convert aggplot2plot into an interactive one (e.g., move, zoom, export image features that are not available in the standardrenderPlot()function). - Similarly, the
DT::dataTableOutput("table")(in theui) and theDT::renderDataTable()(in theserver) from theDTpackage enrich therenderTablefunction. See a live example here.
# ui
plotOutput(outputId = "plot"),
tableOutput(outputId = "table"),
textOutput(outputId = "text")

# ----------------------------

# server
output$plot <- renderPlot({
                 plot(x, y, ...)
})

output$table <- renderTable({
                 data
})

output$text <- renderText({
             "Some text"
})
Control Widgets
Shiny provides a range of control widgets that allow users to interact with your app:
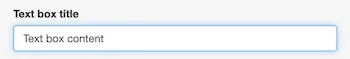
Text box
# textbox that accepts both numeric and alphanumeric input
textInput(inputId = "title", label="Text box title", value = "Text box content")
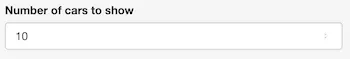
Numeric input
# text box that only accepts numeric data between 1 and 30
numericInput(inputId = "num", label = "Number of cars to show", value = 10, min = 1, max = 30)
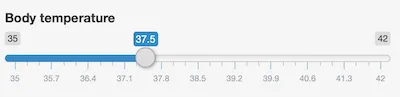
Slider
# slider that goes from 35 to 42 degrees with increments of 0.1
sliderInput(inputId = "temperature", label = "Body temperature", min = 35, max = 42, value = 37.5, step = 0.1)
Range selector
# slider that allows the user to set a range (rather than a single value)
sliderInput(inputId = "price", label = "Price (€)", value = c(39, 69), min = 0, max = 99)

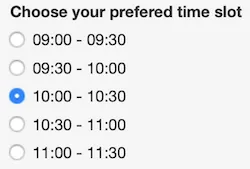
Radio buttons
# input field that allows for a single selection
radioButtons(inputId = "radio", label = "Choose your preferred time slot", choices = c("09:00 - 09:30", "09:30 - 10:00", "10:00 - 10:30", "10:30 - 11:00", "11:00 - 11:30"), selected = "10:00 - 10:30")
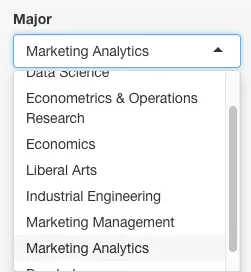
Dropdown menu
# a dropdown menu is useful when you have plenty of options and you don't want to list them all below one another
selectInput(inputId = "major", label = "Major", choices = c("Business Administration", "Data Science", "Econometrics & Operations Research", "Economics", "Liberal Arts", "Industrial Engineering", "Marketing Management", "Marketing Analytics", "Psychology"),
  selected = "Marketing Analytics")
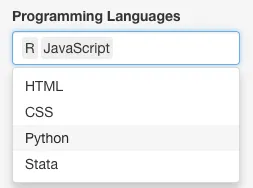
Dropdown menu (multiple selections)
# dropdown menu that allows for multiple selections (e.g., both R and JavaScript)
selectInput(inputId = "programming_language", label = "Programming Languages",
  choices = c("HTML", "CSS", "JavaScript", "Python", "R", "Stata"),
  selected = "R", multiple = TRUE)
Checkbox
# often used to let the user confirm their agreement
checkboxInput(inputId = "agree", label = "I agree to the terms and conditions", value=TRUE)

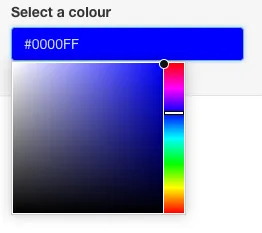
Colorpicker
# either insert a hexadecmial color code or use the interactive picker
library(colourpicker)  # you may first need to install the package
colourInput(input = "colour", label = "Select a colour", value = "blue")
Download Button
Add a download button to your Shiny app so that users can directly download their current data selection in csv-format and open the data in a spreadsheet program (e.g., Excel).
ui <- fluidPage(
  downloadButton(outputId = "download_data", label = "Download")
)

server <- function(input, output) {
    output$download_data <- downloadHandler(
        filename = "download_data.csv",
        content = function(file) {
            data <- filtered_data()
            write.csv(data, file, row.names = FALSE)
        }
    )
}
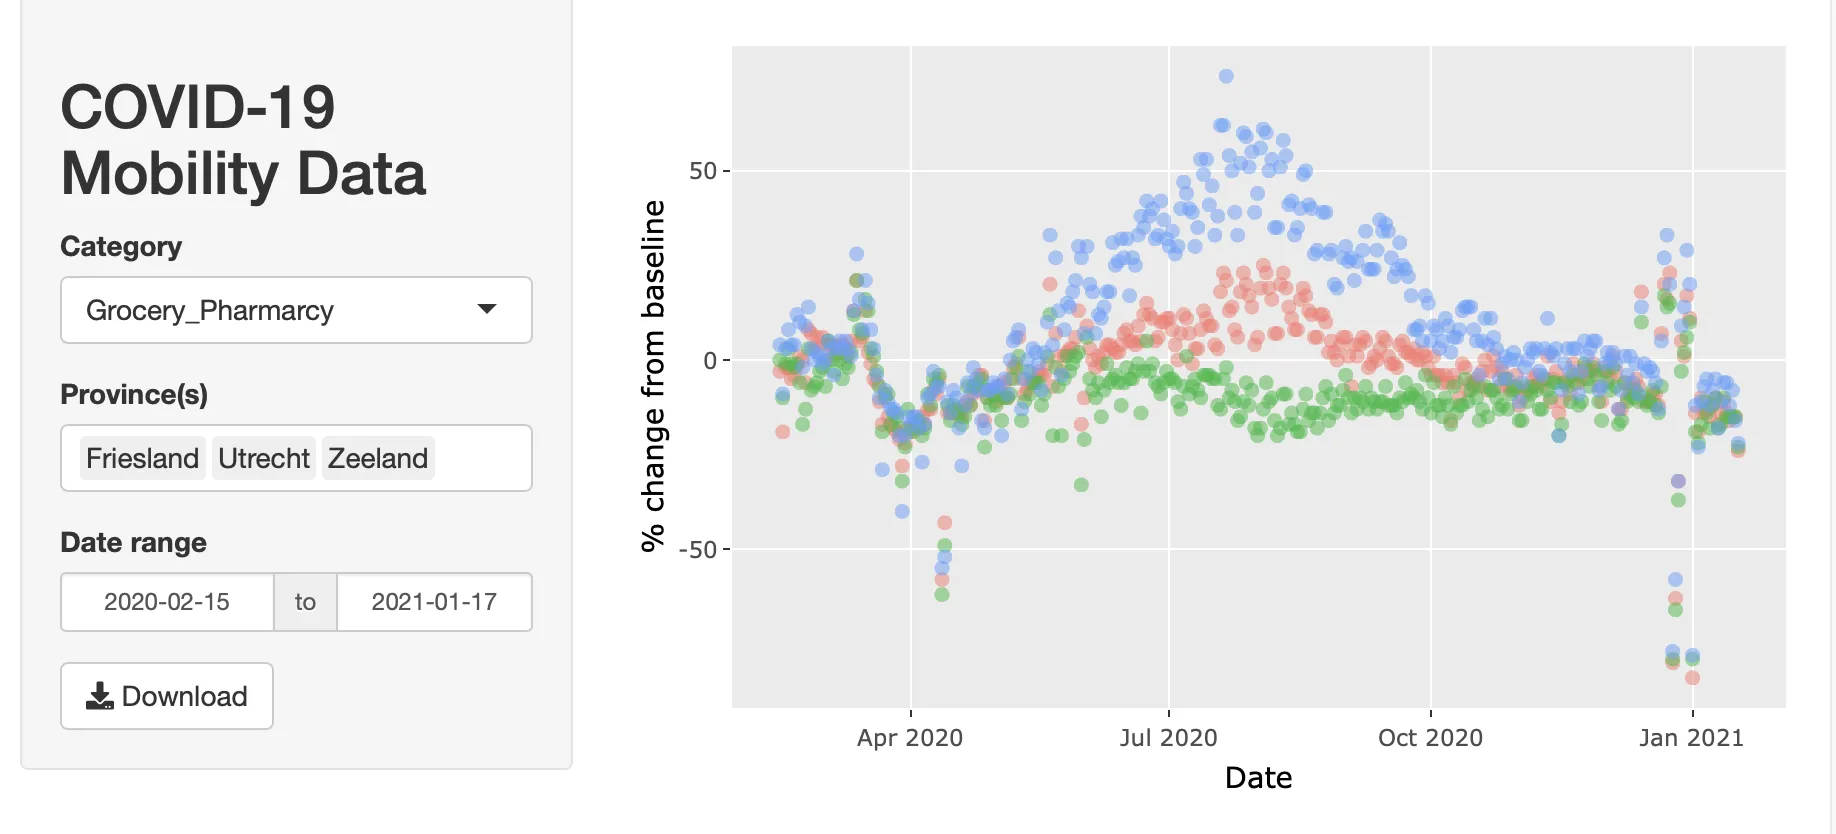
An example
The Shiny app below visualizes Google’s COVID-19 Community Mobility Reports of the Netherlands. A step-by-step tutorial and the source code can be found here.
More resources
- A course on learning Shiny and its necessary package
- Interactive Web Apps with shiny Cheat Sheet
-
 Summary
You've now gained a solid understanding of how to create interactive web applications using Shiny. Feel free to experiment, explore the vast capabilities of Shiny, and tailor your apps to fit your specific needs. With the resources provided and your newfound knowledge, you're well-equipped to embark on your journey into the world of Shiny app development. Happy coding!