


Overview
This article focusses on one of the main concepts in Shiny: reactive programming. This feature stands at the core of Shiny’s dynamic capabilities. Reactive programming in Shiny is essentially about creating a dynamic link between inputs and outputs, ensuring that outputs refresh automatically when there's a change in inputs.
The Shiny app we will use is the airquality dataset, which is available in R by default. This dataset contains daily air quality measurements in New York, May to September 1973. We will progressively build a Shiny app that demonstrates various aspects of reactivity in Shiny using ggplot2 for visualization. The app will allow users to interact with the airquality data, filtering and visualizing it based on their inputs.
First, we'll set up a basic Shiny app structure and display the airquality dataset in a DTtable.

library(shiny)
library(DT)
library(ggplot2)

# Define UI
ui <- fluidPage(
  titlePanel("Air Quality Analysis"),
  DTOutput("table")
)

# Define Server
server <- function(input, output) {
  output$table <- renderDT({
    airquality
  })
}

# Run the App
shinyApp(ui, server)
 Tip
TipDT package
The DT package, short for DataTables, allows for a improved presentation as well as it adds interactivity within tables in Shiny apps. It provides features that are not available with standard Shiny tables:
- Pagination: Allows users to navigate through large datasets easily.
- Search Functionality: Users can quickly search and filter data in the table.
- Dynamic Sorting: Columns can be sorted dynamically by the user.
- Responsive Design: Tables are more responsive and can adjust to different screen sizes.
To use DT in Shiny, you replace the standard tableOutput() and renderTable() functions with DT::dataTableOutput() and DT::renderDataTable().
To learn how to use DT to build an data exploration app check out this article.
Reactivity in Shiny
Reactive programming is a coding style that revolves around managing values that change over time and orchestrating actions based on those changes. In Shiny applications, this concept is crucial because users interact with dynamic controls like sliders and checkboxes. These interactions trigger server-side processes, such as data retrieval and updates to output elements. This differs from typical R code, which typically deals with static data.
Reactivity establishes connections between user inputs and specific elements in the user interface (UI). When user inputs change, associated UI components update dynamically. Additionally, reactivity enables efficient data handling through selective updates, conserving server resources and enhancing performance. This "lazy" evaluation minimizes unnecessary computational load, boosting server efficiency.
In summary, reactivity offers benefits, including:
- Engagement through Dynamic Interaction: Users interactively shape the application by interacting with input elements, providing real-time updates in the output, ensuring a engaging user experience.
- Efficient Data Handling: By selectively updating only relevant portions of the application, reactivity conserves resources, enhances server performance, and ensures responsiveness.
To understand reactivity, we need to delve into its key components: reactive sources, reactive endpoints, and reactive conductors.
Reactive Sources & Endpoints
In Shiny, reactive sources refer to the inputs that trigger reactivity in the application. These are usually UI elements that allow users to interact with the app, like sliders, text inputs, buttons, checkboxes, etc. When a user interacts with these elements, their values change, which then triggers updates elsewhere in the app, the connected reactive endpoints.
Reactive endpoints are the elements in a Shiny app that visibly react to changes in their dependencies, such as user inputs. These endpoints are crucial for displaying updated information or results based on user interaction.
Reactive conductors
In Shiny, reactive conductors, also known as reactive expressions, play a crucial role in optimizing the app's performance and organization. They are used to process or modify reactive inputs before these inputs influence the outputs.
They are 'lazy', activating only upon an endpoint's request, and 'cached', meaning they recompute only when there's a change in their input sources. This lazy and cached nature of reactive expressions optimizes the workflow of reactivity in Shiny.
Reactive conductors offer several key benefits:
- Efficiency: They prevent the repetition of calculations. If multiple outputs depend on the same processed data, a reactive conductor calculates it just once, even if the input changes.
- Organization: Reactive conductors keeps the server logic organized by compartmentalizing the data processing steps.
- Reactivity Management: Reactive conductors provide control over the activation of reactivity, contributing to predictable and manageable app behavior..
As a fundamental aspect of reactivity, reactive conductors act as intermediaries between reactive sources (like user inputs) and endpoints (such as UI outputs).
In essence, the reactivity in Shiny apps comprises:
- Reactive Sources: These are user inputs that initiate changes within the app.
- Reactive Endpoints: Elements in the UI, like plots or tables, that reactively update in response to changes.
- Reactive Expressions: These process and prepare inputs before they affect the outputs.
library(shiny)
library(dplyr)
ui <- fluidPage(
titlePanel("Air Quality Analysis"),
sidebarLayout(
sidebarPanel(
# Reactive Source: Dropdown menu for selecting the month
selectInput("monthInput", "Select Month:",
choices = month.abb[5:9], # Only May to September months
selected = "May")
),
mainPanel(
textOutput("avgTemp"),
textOutput("avgWind")
)
)
)
server <- function(input, output) {
# Reactive Conductor: Processes data based on the selected month (reactive source)
processedData <- reactive({
selectedMonth <- match(input$monthInput, month.abb) # Mapping month name to number
airquality %>%
filter(Month == selectedMonth) %>%
summarize(AvgTemp = mean(Temp, na.rm = TRUE),
AvgWind = mean(Wind, na.rm = TRUE))
})
# Reactive Endpoints: Display the processed data
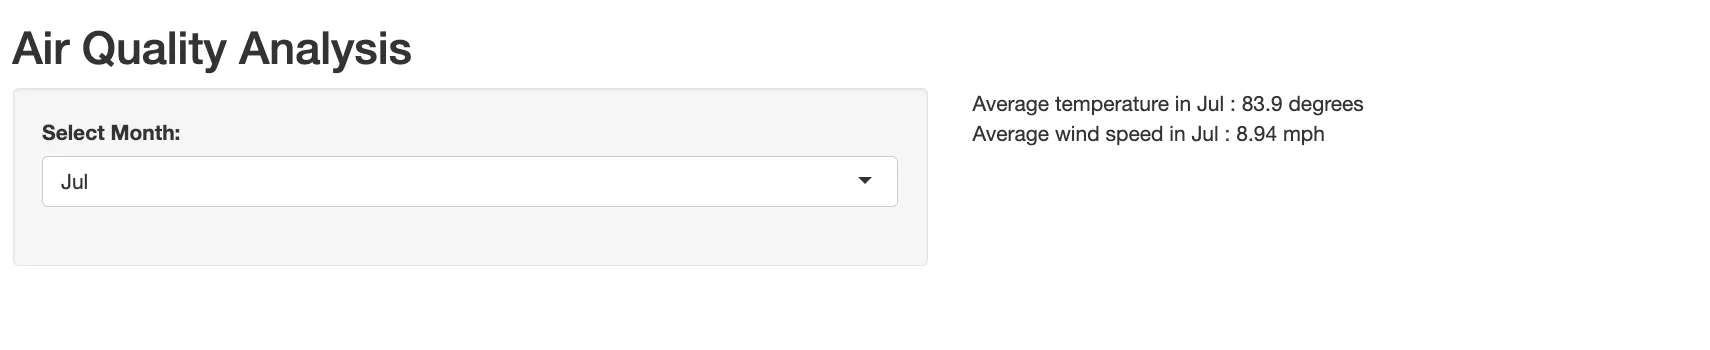
output$avgTemp <- renderText({
data <- processedData()
paste("Average temperature in", input$monthInput, ":", round(data$AvgTemp, 2), "degrees")
})
output$avgWind <- renderText({
data <- processedData()
paste("Average wind speed in", input$monthInput, ":", round(data$AvgWind, 2), "mph")
})
}
shinyApp(ui, server)
 Example
Breakdown of the Example
- Reactive Source (
monthInput): ThisselectInputdropdown menu is the reactive source in the app. When the user selects a month, it triggers thereactivity. - Reactive Conductor (
processedData): This reactive expression processes theairqualitydata based on the selected month from thereactive source. - Reactive Endpoints (avgTemp and avgWind): These text outputs display the average temperature and wind speed, respectively. They update reactively when the processedData changes.
By combining reactive sources, conductors, and endpoints, this Shiny app dynamically updates its outputs based on user interaction.
Observers
Observers in Shiny are designed to perform actions based on reactive inputs. Observers don't like to wait around. As soon as the conditions they're monitoring occur (like a user changing a slider value), they spring into action. Observers are thus 'eager', however they are also 'forgetful', executing as soon as possible and not retaining memory of their actions. If they depend on a reactive expression, that expression will also be evaluated.
You create observers using Shiny's observe() function.
- How It Works: Inside observe(), you write the code that you want to run in response to certain changes. This could be changes to input values, like a user selecting an option from a dropdown menu.
- Reactivity Link: The observer keeps an eye on the things you've told it to (like input values). When those things change, the code inside your observe() function runs automatically.
Observers versus reactive expressions
Understanding the difference between reactive expressions(reactive conductors) and observers is key to effective app development.
Observers:
- Purpose: Designed for actions and side effects, like updating the UI or writing to files.
- Behavior: Eager and forgetful, they execute immediately in response to changes and do not remember past actions.
- Dependency: If they rely on a reactive expression, it triggers the evaluation of that expression.
Reactive Expressions:
- Purpose: Used for computing and transforming data based on reactive inputs.
- Behavior: Lazy and cached, they only recompute when their dependencies change and when their results are needed.
- Dependency: They do not initiate actions but are often used within observers or outputs to provide dynamic data.
# Server logic
server <- function(input, output) {
  # Observer for reactivity: Responds to month selection changes
  observe({
    selectedMonth <- match(input$monthInput, month.abb)
    filteredData <- airquality %>%
      filter(Month == selectedMonth)

    if(nrow(filteredData) == 0) {
      output$summary <- renderText("No data available for the selected month.")
      return()
    }

    summaryResult <- filteredData %>%
      summarize(AvgTemp = mean(Temp, na.rm = TRUE), AvgWind = mean(Wind, na.rm = TRUE),
                MaxTemp = max(Temp, na.rm = TRUE), MinTemp = min(Temp, na.rm = TRUE))

    # Update the summary output
    output$summary <- renderText({
      paste("Avg Temp:", round(summaryResult$AvgTemp, 2), "°F. Avg Wind:", round(summaryResult$AvgWind, 2),
            "mph. Max Temp:", summaryResult$MaxTemp, "°F. Min Temp:", summaryResult$MinTemp, "°F.")
    })
  })

  # Reactive plot output: Updates based on the month and wind speed selected by the user
  output$airQualityPlot <- renderPlot({
    filteredData <- airquality %>%
      filter(Month == match(input$monthInput, month.abb),
             if(input$showAllData) TRUE else Wind > input$windSlider)

    ggplot(filteredData, aes(x = Temp, y = Wind)) +
      geom_point(aes(color = factor(Day)), size = 5) +
      theme_minimal() +
      labs(x = "Temperature (°F)", y = "Wind Speed (mph)", color = "Day of Month",
           title = paste("Temperature vs Wind Speed in", input$monthInput))
  })
}
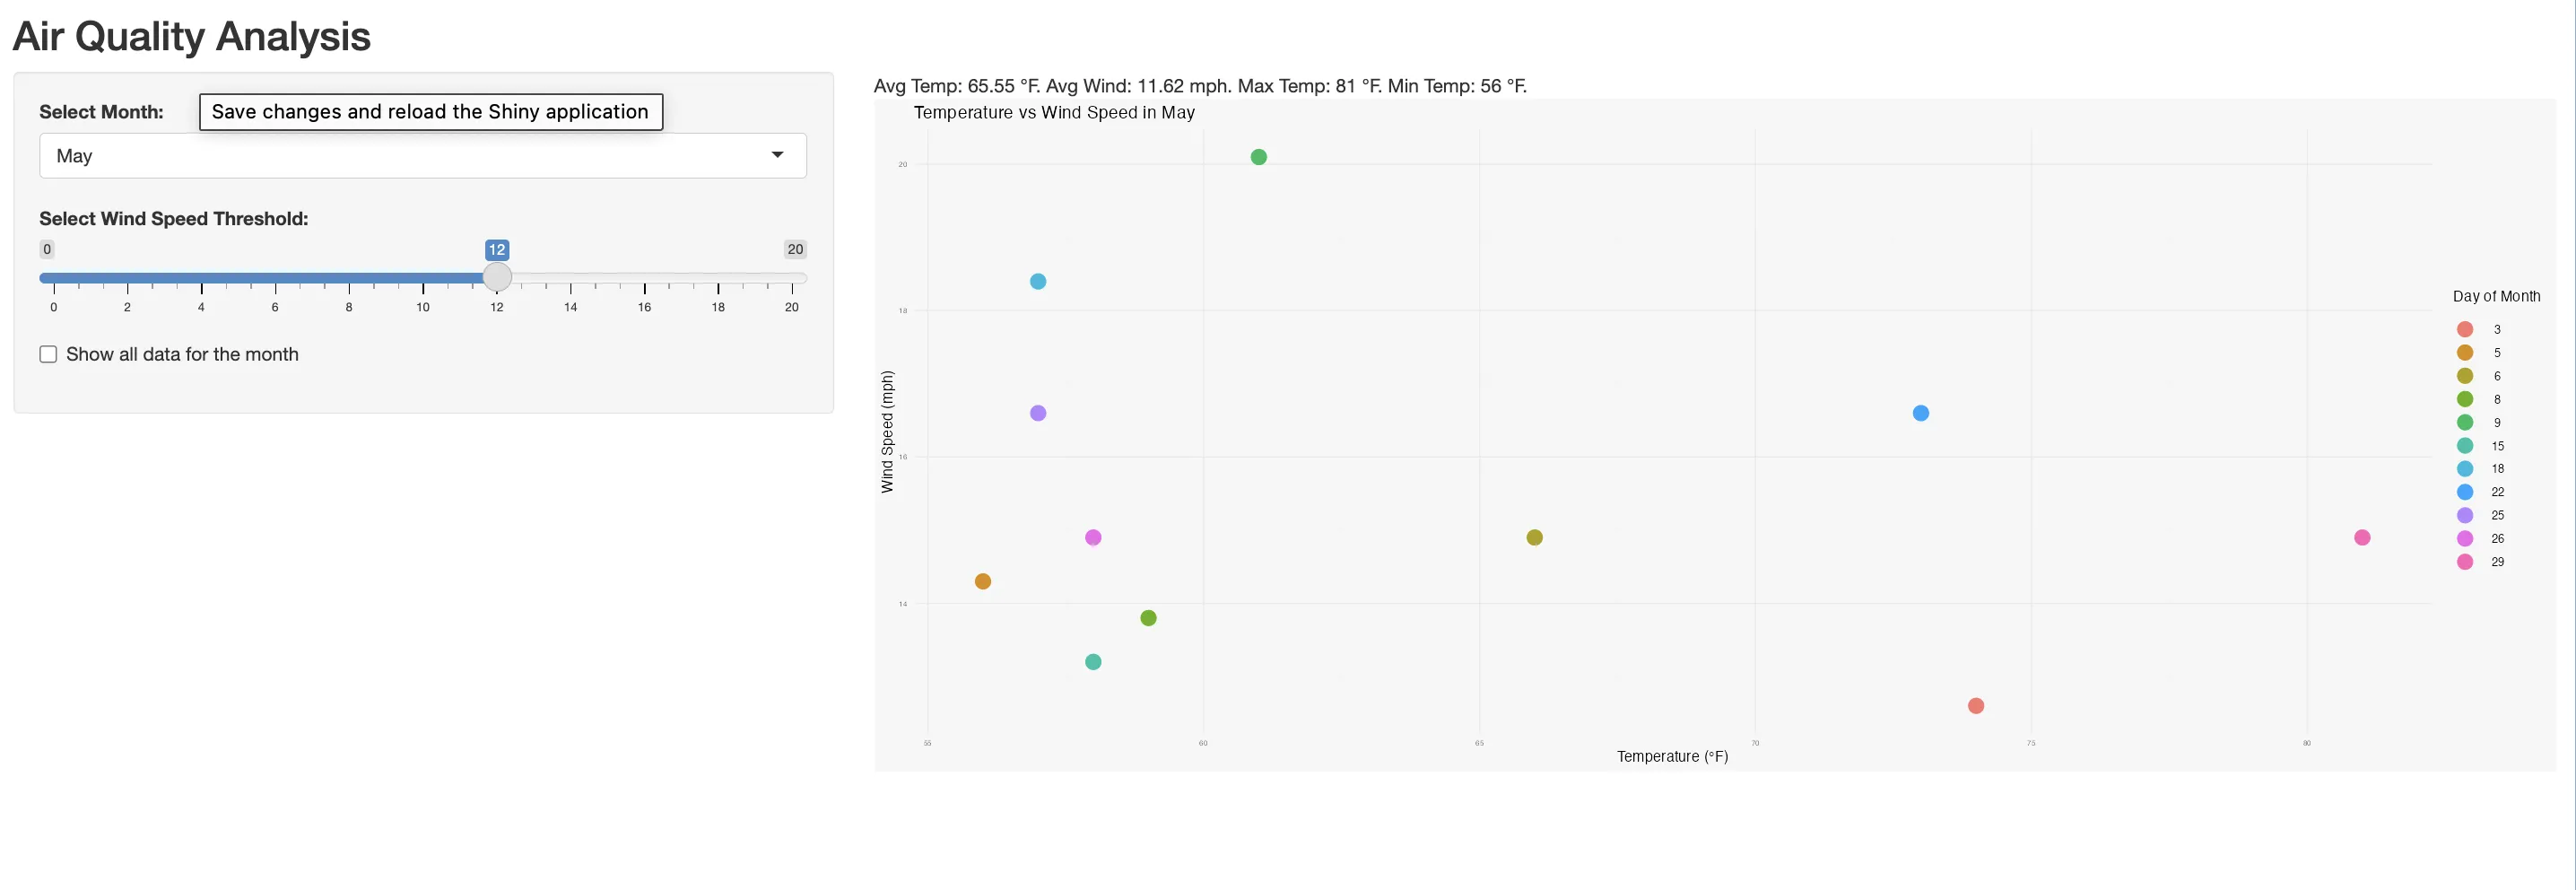
ExampleObserver Implementation
The observe() function is employed to create an observer that monitors changes in the monthInput. When the user selects a different month, this observer is triggered, leading to the execution of the code block inside it.
TipUtilizing reactlog for understanding reactivity
By integrating the package reactlog into your Shiny app, you can visually trace how reactivity is activated. it allows you to visualize and better understand the interactions between observers, reactive expressions, and inputs in your Shiny app.
Install and Enable:
- Install the reactlog package
- Enable it in your app using reactlog::reactlog_enable().
During App Execution:
- pressCmd + F3 (Mac) or Ctrl + F3 (Windows/Linux) to open the reactlog visualization.
After App Closure:
- execute shiny::reactlogShow() in the R console to view the complete reactive graph of the session.
Let's examine a comprehensive example that integrates observers, reactive sources, endpoints, and expressions to illustrate their interconnected roles.

# Download the example file in the right corner
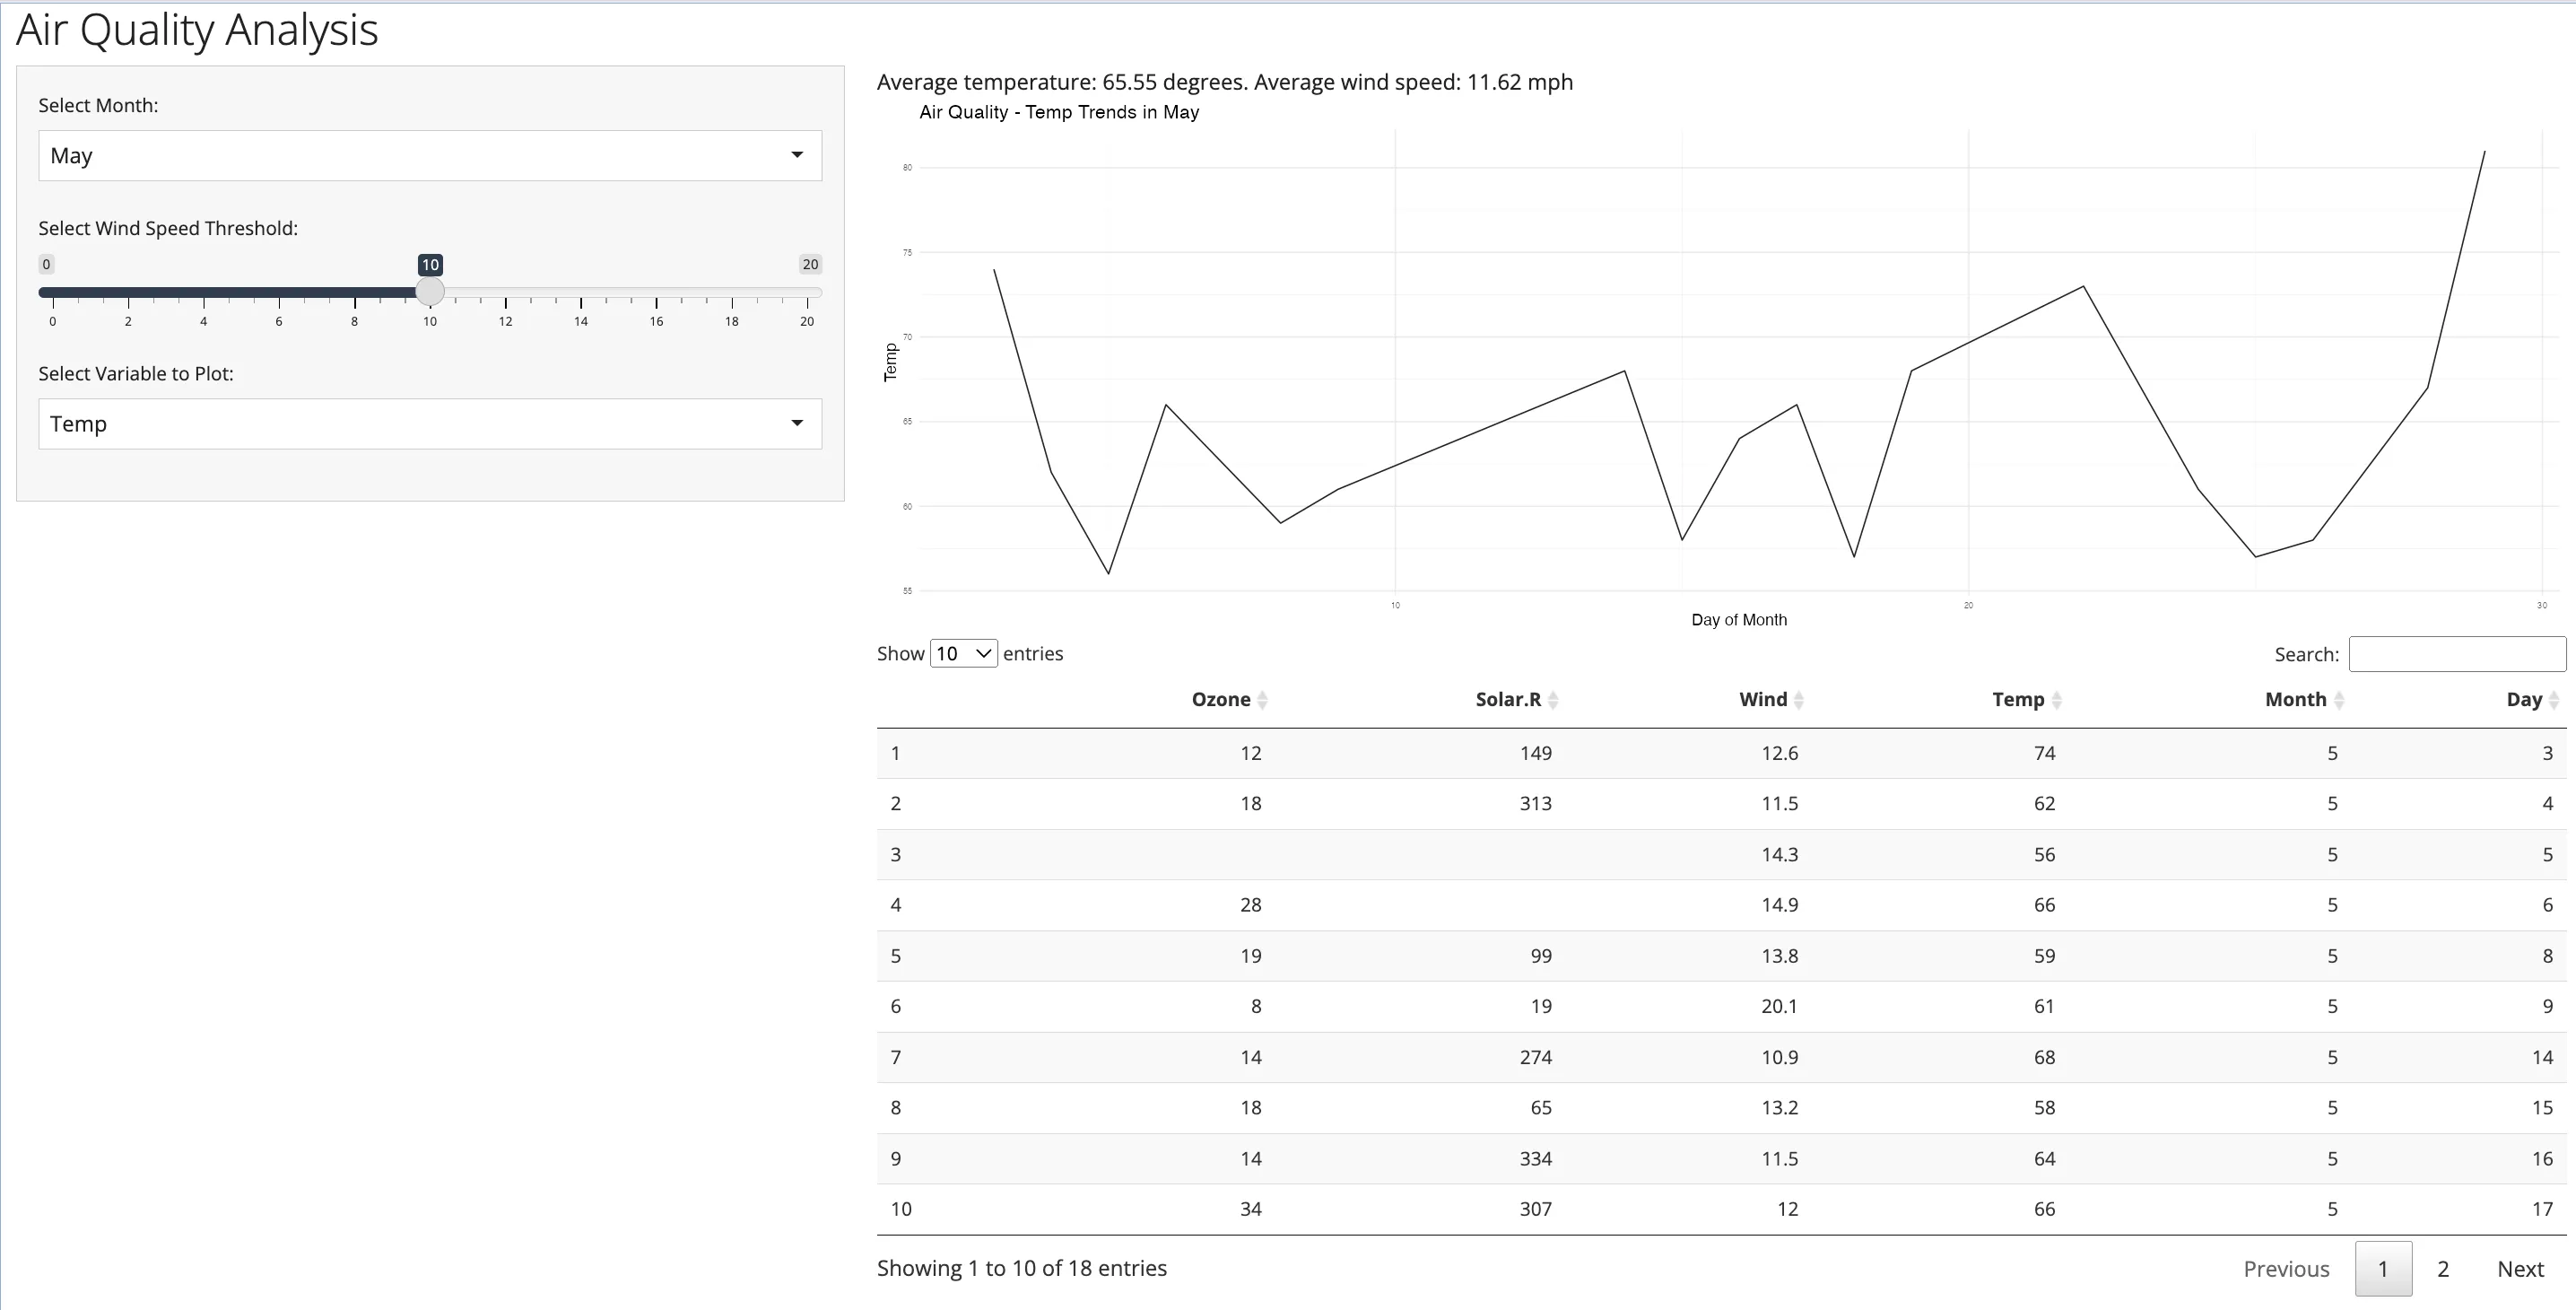
ExampleThis example contains:
- Reactive Value summaryData:
- summaryData is a reactive container that stores summary results, like average temperature and wind speed.
- It allows dynamic updates triggered by user inputs or other reactive events.
- Observer for Month Selection:
- An observer, created with observe, tracks changes in the selected month.
- When the month changes, it:
- Filters airquality data for the selected month.
- Calculates average temperature and wind speed.
- Updates summaryData with the results.
- Reactive Outputs:
- Three reactive outputs dynamically update in response to user inputs:
- output$summary: Displays the summary.
- output$airQualityPlot: Renders a ggplot visualization.
- output$dataTable: Shows a DataTable with filtered data.
 Summary
This article introduces the concept of reactive programming in Shiny, key to developing dynamic, interactive web applications. We have discussed the following concepts:
Reactive Programming: Creates a dynamic link between user inputs and outputs, automatically updating outputs when inputs change.- Components of
Reactivity: Consists ofreactive sources(user inputs),reactive conductors (data processing expressions), andreactive endpoints(UI elements that update in response to changes). - Use of
Observers: Implements observers in Shiny for immediate actions based on changes in reactive inputs, like updating UI or triggering events. - Reactivity Visualization with
Reactlog: Utilizes the reactlog package to trace and visually represent the interactions and flow of reactivity within the application.
In the next article of the series, we will dive into modules.