


Overview
This article is designed for beginners who are stepping into the world of interactive web application development using R Shiny. Our aim is to streamline the learning process, offering a clear and organized approach for those new to Shiny. This article aims to provide the foundational knowledge and step-by-step instructions to get started with creating dynamic, user-interactive web applications using R Shiny.
By the end of this article, you'll grasp the fundamental concepts of Shiny app architecture, including the interplay between UI (User Interface) and server components. Additionally, you'll learn to implement basic interactivity and customization features. We'll apply these concepts to develop an interactive web application using the Gapminder dataset, providing a practical, hands-on experience.
Introduction to R Shiny
What is R Shiny?
R Shiny is a tool developed to build web applications with the programming language R.
Therefore, it eliminates the need for traditional web development skills like JavaScript, HTML, or CSS.
It's designed specifically for data scientists, statisticians, and researchers, allowing them to build client-side and server-side components within a familiar coding environment.
Why use R Shiny?
The strength of Shiny lies in its ability to make data and statistical analyses engaging and interactive, making it ideal for anyone looking to present their findings in a dynamic and user-friendly format. This tool is perfect for building a wide range of applications, from interactive dashboards and complex data exploration tools to simulation platforms.
Building a Shiny app
Core Structure
In R Shiny, every application consists of two main components:
1. The User Interface (UI)
The UI is what users interact with when they run your Shiny application. It's essentially a web page constructed using R commands. This interface is responsible for:
- Displaying information: Text, tables, charts, images, etc.
- Collecting user input: Through interactive elements like text boxes, sliders, and buttons.
- The Server
The Server, on the other hand, is where the app's logic resides. It processes the input from the UI, performs computations, and sends output back to the UI. Key aspects of the Server include:
- Reactivity: The server responds to changes in user input specified in the UI, recalculating outputs as needed.
- R code: All processing is done using R.
 Tip
TipReactivity: The Magic of Shiny
One of the most powerful features of Shiny is reactivity. Reactivity in a Shiny app means that the output automatically updates whenever the user changes an input. To learn more about reactivity, check out this article.
Let's create a simple Shiny app:

# Ensure the Shiny package is installed and loaded
install.packages("shiny")
library(shiny)

# Define the User Interface (UI)
## All the objects in the user interface (inputs and outputs) will be written inside this function.
ui <- fluidPage(
"Welcome to the TilburgScienceHub"
)

# Define the Server function
## The server function takes the input values (specified by the user) and creates the output objects that will be displayed in the user interface.
server <- function(input, output) {
}

# Run the Shiny application
## Requires two arguments, corresponding to the app's core components. ui is assigned to the user interface object, and server to the server object.
shinyApp(ui = ui, server = server)
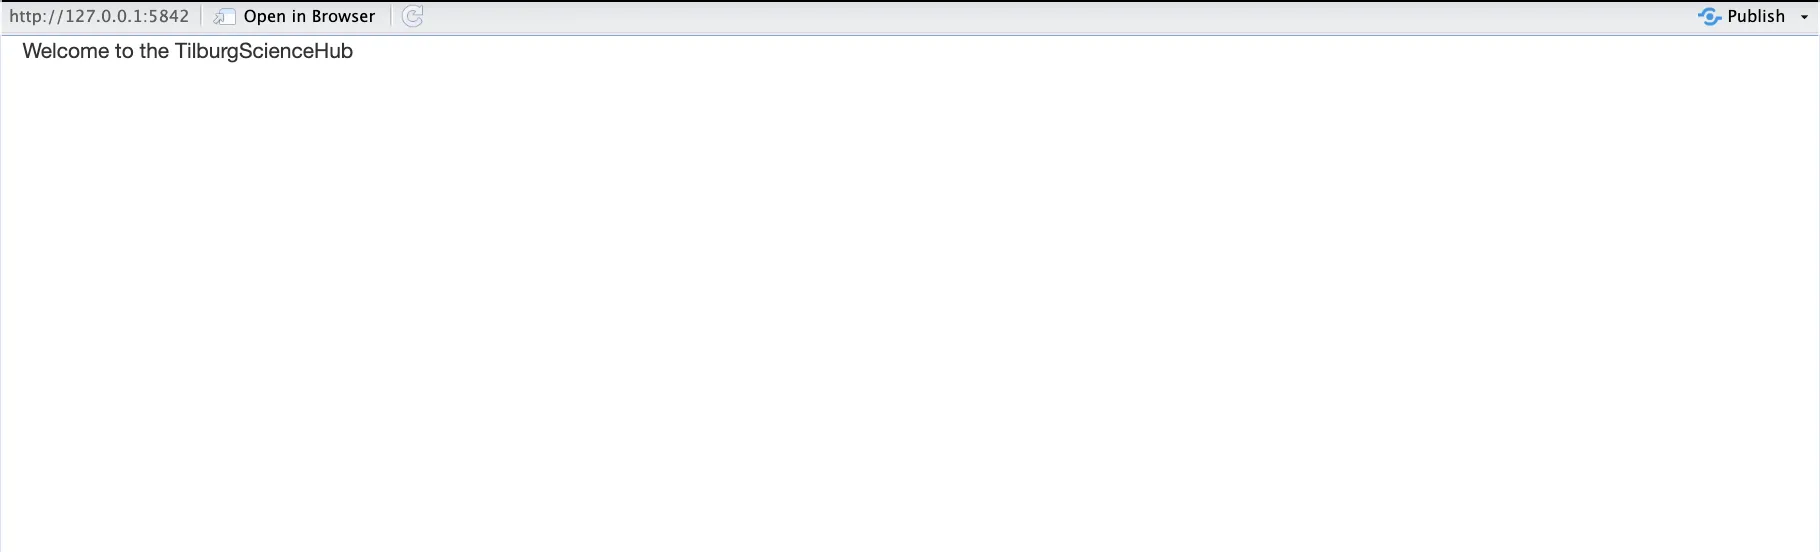
This basic app displays the welcome message: "Welcome to the TilburgScienceHub".
TipR Studio Users
- When creating
Shinyapps, organize them in dedicated folders separate from other projects for streamlined development. - Use
Cmd/Ctrl + Shift + Enterinstead of clicking "Run App" to run your app efficiently. The efficient cycle involves writing code, launching the app with the shortcut, testing it interactively, closing it, and then repeating the process.
Building The User Interface
Formatting
When creating a Shiny app start with constructing the User Interface. In this section the focus is on its layout design using the fluidPage() function. This function helps create a fluid and responsive web page layout. Here's how to structure it:
- Create a Header: Utilize
titlePanel()to add a header to your app. - Layout Organization: Use
sidebarLayout()to arrange your app's inputs and outputs.- This layout divides the page into a sidebar and a main panel.
- Inputs Section: Place input controls in the
sidebarPanel().- This section typically appears on the left side of your app.
- Outputs Section: The
mainPanel()is used for displaying outputs like plots, tables, or text outputs.- It usually occupies the central or right portion of the layout.
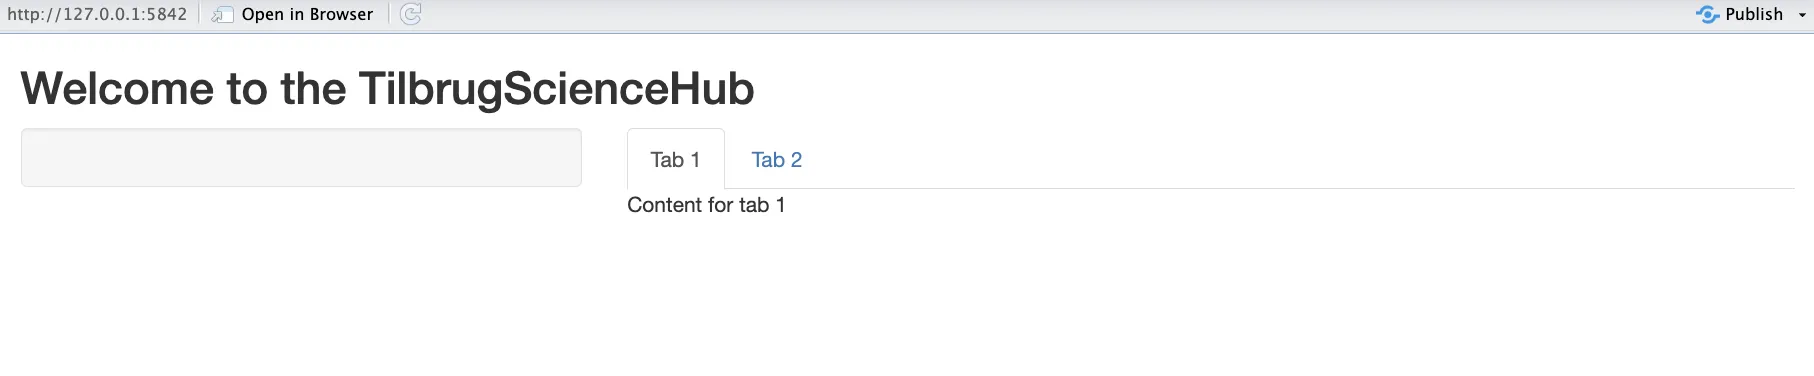
- Tabbed Interface: Integrate
tabsetPanel()for adding tabs to your app.- It enhances navigation and organization, especially for apps with multiple data views or functionalities.
- Within
tabsetPanel(), usetabPanel()to create individual tabs and define their content.
# Define the User Interface (UI)
ui <- fluidPage(
    titlePanel("Welcome to the TilburgScienceHub"),
    sidebarLayout(
        sidebarPanel( # This goes into the sidebar on the left
             # Input elements will be added here
        ),
        mainPanel( # This goes into the panel on the right
          tabsetPanel(
                tabPanel("Tab 1", "Content for tab 1"),
                tabPanel("Tab 2", "Content for tab 2")
                # Additional tabs can be added here)
          )
        )
    )
)
TipImportant Coding Practices
When writing Shiny code, ensure that all UI elements within functions like fluidPage, sidebarLayout, and tabsetPanel are separated by commas. Missing commas can cause the app to crash, so it's a good habit to double-check your code for these small but significant details.
Creating inputs
So far, we've established the basic structure of our Shiny app with a header. In Shiny, creating interactive input controls is the key aspect of engaging user interfaces. The variety of input types within Shiny available allows for a highly interactive and customizable user experience.
Incorporating an input control in Shiny is a straightforward two-step process:
- Add an Input Function in the UI:
- This is done by using a specific ...Input("id", ...) function, where "id" is a unique identifier for the input control.
- Access the Input Value in the Server:
- Retrieve the input's value in the server logic using input$id, where id is the identifier assigned in the first step.
 Example
Example Inputs
sliderInput: Allows users to select numerical values or ranges, such as years.selectInput: Provides a dropdown menu for users to choose from a predefined list of options, like countries.numericInput: Allows users to select a range of numbers, which can be increased or decreased using arrows.dateRangeInput: Enables users to pick a date from a calendar dropdown.
Shiny offers a wide range of input types. Choose controls that best fit your app's design and user needs.
All input functions in Shiny share common characteristics:
- Input ID: A unique identifier for each input control, crucial for accessing its value in the server.
- Label: A descriptive text label for the input, visible to users.
- Unique Arguments: Each input type has specific parameters.
For instance, selectInput needs a list of choices, while sliderInput requires default values, minimum, and maximum limits.
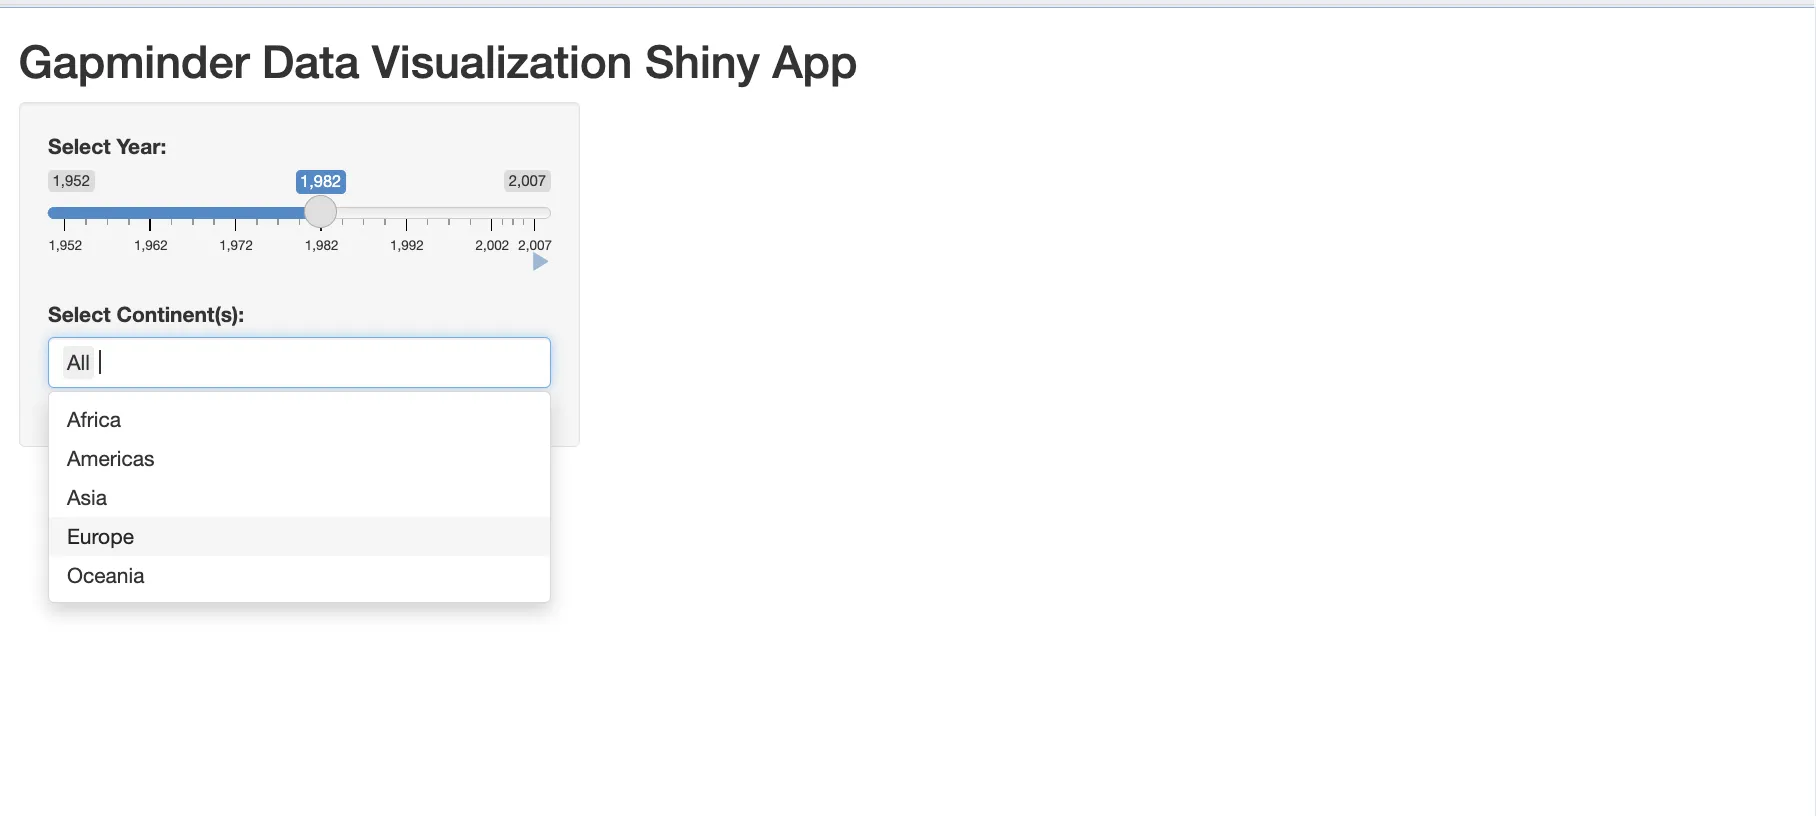
Here is an example app:
library(gapminder)

# Define the User Interface (UI)
ui <- fluidPage(
    titlePanel("Gapminder Data Visualization Shiny App"),
    sidebarLayout(
        sidebarPanel(
            # Slider input for selecting the year
            sliderInput("yearInput", "Select Year:",
                        min = 1952,
                        max = 2007,
                        value = 1952,
                        step = 5,
                        animate = TRUE), # Adding animation for a better user experience

            # Dropdown menu for selecting continents
            selectInput("continentInput", "Select Continent(s):",
                        choices = c("All", sort(unique(as.character(gapminder$continent)))),
                        selected = "All",
                        multiple = TRUE)
        ),
        mainPanel(
        # This is where outputs like plots or tables will be displayed
        )
    )
)
With the inputs configured, we've laid the groundwork for interactive user experiences in our Shiny app. Up next, we'll delve into output elements and how they can display dynamic, user-driven data.
Output Placeholders
When developing a Shiny app, one of the initial steps is to define the output objects and their placement within the user interface (UI). This is achieved using output placeholders.
Shiny provides a several output functions, each tailored to different output types. To use these functions:
1. Assign a Unique Name or ID: Each output function requires a unique name or ID. This identifier should be a character string enclosed in double quotes.
2. Place Output Placeholders in the UI: These placeholders specify the locations and types of outputs that will appear in the app. They are not the actual outputs but markers for where the outputs will be displayed.
3. Creation of Outputs in the Server Function: While placeholders are set in the UI, the actual outputs are generated in the se`rver function.
The user interface is ready. It contains both input controls and output placeholders. In the following sections, we’ll move our focus to the server function, because it’s the server side of our app that builds the output objects.
# Add an output placeholder to the mainPanel
ui <- fluidPage(
    titlePanel("World Health Data Explorer"),
    sidebarLayout(
        sidebarPanel(
            selectInput("country", "Select a Country:",
                        choices = c("Country A", "Country B", "Country C"),
                        selected = "Country A")
        ),
        mainPanel(
                 plotOutput("gapPlot") # Output to display the plot
        )
    )
)
The Server Function
Understanding Reactive Programming
Before we dive into the server function, it's important to understand the concept of reactive programming in Shiny.
Reactive programming is key to Shiny's interactivity. It establishes a dynamic connection between the UI and the server, allowing for real-time app interactions. For instance, when a user adjusts a slider in the UI, the server instantly updates relevant outputs like graphs. This means changes in inputs immediately reflect in outputs, eliminating the need for manual updates.
Defining Outputs in the Server Function
Outputs are generated within the server using render functions, each tailored to produce specific types of visualizations, such as renderTable for tables, renderImage for images, and renderPlot for plots. These outputs, once generated by the server, are then displayed in the UI using corresponding output functions.
The process of adding outputs to a Shiny app involves several key steps:
1. Creating the Output: Define the type of output (plot, table, text, etc.).
2. Render the Output: Use a suitable render... function matching the output type.
3. Assign the Rendered Object: Connect the output to an identifier (output$ID).
4. Incorporating the Output in UI: Place the output in the UI using the matching ...Output function.
Remember, the content within a render... function is enclosed in curly braces ({...}), ensuring proper execution and display of the output.
server <- function(input, output) {
# Render plot based on user input (Reactivity)
output$gapPlot <- renderPlot({
# Filter the gapminder data for the selected year
data <- gapminder %>%
filter(year == input$yearInput)
# If a specific continent is selected (other than "All"), filter data by that continent
if (input$continentInput != "All") {
data <- data %>% filter(continent == input$continentInput)
}
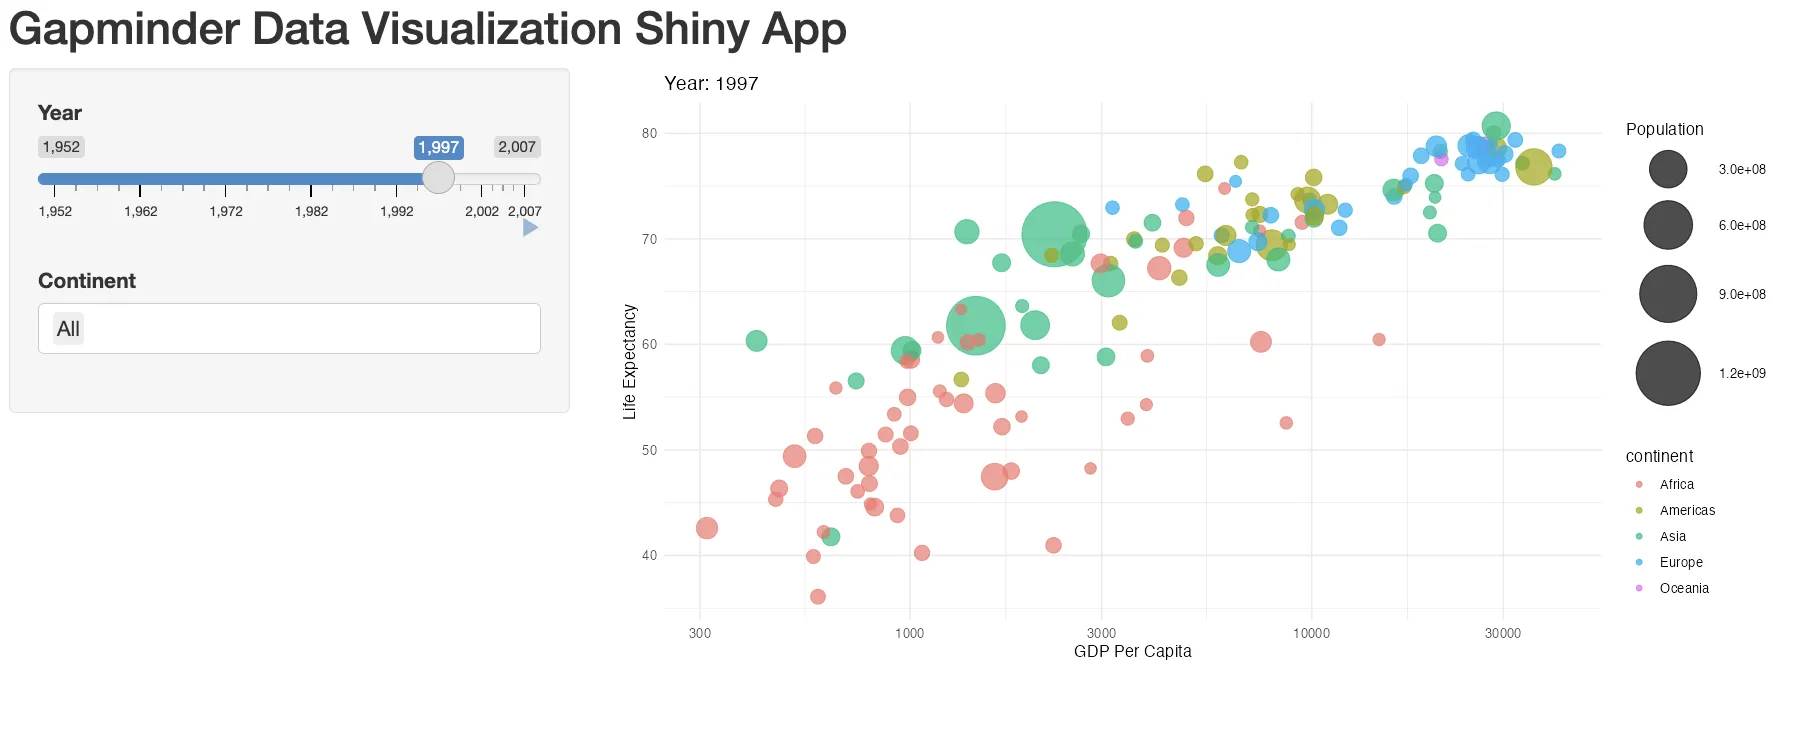
# Create a ggplot
ggplot(data, aes(x = gdpPercap, y = lifeExp, size = pop, color = continent)) +
geom_point(alpha = 0.7) + # Use point geometry with some transparency
scale_size(range = c(3, 20), name="Population") + # Scale size for population visualization
scale_x_log10() + # Use a logarithmic scale for the x-axis (GDP Per Capita)
theme_minimal() + # Apply minimal theme for aesthetics
labs(title = paste("Year:", input$yearInput), # Add title with the selected year
x = "GDP Per Capita", # Label for x-axis
y = "Life Expectancy") # Label for y-axis
})
}
shinyApp(ui = ui, server = server)
TipIn Shiny, each render{Type} function is designed to produce a specific type of output, such as text, tables, or plots. These functions should be used with their corresponding {type}Output function. For instance, renderTable() is paired with tableOutput() to display tables. This pairing is crucial for the correct processing and display of data within the app's user interface, ensuring your data is processed and then correctly displayed in your app's user interface.
Summary
 Summary
In this first article of the series we have discussed:
- R Shiny Overview: We introduced R Shiny, a tool for creating web applications using R.
- Shiny's Core Structure: We explored the two main components of Shiny apps: the User Interface (UI) and the Server. The UI is the front end that users interact with, while the Server is the backend where the app's logic and data processing occur.
- Building the UI: This section walked through the process of constructing a user interface.
- Server Function and Reactivity: We delved into the server function and the concept of reactive programming.
- Output Creation and Placement: Finally, we covered how to define and place output objects in the UI and generate them in the server.
This article is aimed to provide a clear, structured pathway to understand and start building web apps with R Shiny, setting a foundation for more advanced learning and application development. The next article in the series dives deeper into the user interface.
Source Code

# Download the code used in this article via the top right corner