


Overview
The typical structure of an empirical paper, a master or Ph.D. thesis in economics and business involves the following sections:
- Abstract
- Introduction
- Literature review
- Institutional background
- Conceptual framework
- Data
- Method
- Results
- Discussion
- Conclusion
- References
- Appendix
- Online appendix
The outline is discussed chapter-by-chapter. Keep in mind that the chapter structure/order might slightly differ depending on your official formatting guidelines, but the content should be more or less in the same order.
Abstract
Be as brief as possible and avoid word-by-word duplication with the introduction. State very clearly what the main take-away is for your paper. This can be a qualitative finding, but it can also be a number.
Introduction
There is not one structure that always works, but here's a structured approach that is well-suited as a starting point:
- Implicit research question Begin your introduction by providing a general motivation for your paper, introducing the reader to the topic and establishing the importance of the practical problem.
Subsequently, implicitly state your research question. Instead of saying "My research question is: "What is the effect of X on Y?", state it as "Therefore, it is crucial to understand ..."
For refining your research question, check out the topic on Preparation for your Thesis.
- Motivate your research question
Explain why it this topic is important and interesting. Think about using economic factors, social or political implications, or evidence relevance to top management, to convince the reader of the importance. Example sentences are "Studying the effect of X on Y is crucial to..", or "The effect of X on Y is worth studying because.."
-
Literature review: Briefly summarize the relevant literature (not all the literature) and explain in detail how you contribute to it with your paper.
-
Briefly explain your data, methods, and results.: Give an overview of what data you are using, with what methods you will study the research question, and what the results are.
-
The outline of the next chapters: Describe what sections will come after the introduction.
 Tip
TipLook at other (similar) papers as an example on how to phrase what you want to say.
Literature review
The literature review is included in the introduction or has its own chapter right after the introduction. It serves to explain existing research, what is missing and what your contribution will be. A good approach is to keep the order as of answering these three questions:
-
What is known already? Explain what other studies say about your topic and show connections between your work and theirs. Example sentences are: “My research relates to extant literature in the following ways..."/"My research contributes to the following literature..." Rather than just giving a summary, give a "synthesis" of existing literature.
-
What do we not know? Identify the gap in relevant literature. On what does existing literature miss out?
-
What is your contribution? Explain how your thesis adds to the existing knowledge. E.g. a new problem, new data, new theory, or a new method. Revise the Preparation section to see how you can best formulate your contribution. Example sentences are: “Our research extends extant research by…”, or “Therefore, as a first contribution, we ...”.
TipCreating a table to categorize existing literature alongside your contribution can provide a clear visual representation of how your research adds value to the existing knowledge.
Institutional Background
The institutional background aims to provide contextual information within which your research takes place. It can include details about the institution, organization, or broader socio-economic factors that might influence or impact the subject under investigation. Be brief and focus on what is relevant for your study. Provide one or a few references. Don't go too much into the details unless necessary.
Conceptual framework
This chapter explains the hypothesized relationship between X (the covariates) and Y (the dependent variable) by grounding it in existing theory or your own logical reasoning.
Moreover, consider alternative arguments: while X may predominantly suggest a positive relationship, it's valuable to think about potential scenarios where it could demonstrate a negative correlation.
Start this section with presenting your argumentation and end by explicitly stating your hypothesis. A hypothesis outlining the direction of the effect (looking for causality) is much stronger than just hypothesizing there is an effect.
Visualizing your framework
Integrating a visual representation of your conceptual framework makes it easier to understand (for you and the reader!).
Example of a conceptual diagram
Below is an example of a conceptual framework in the field of Marketing.
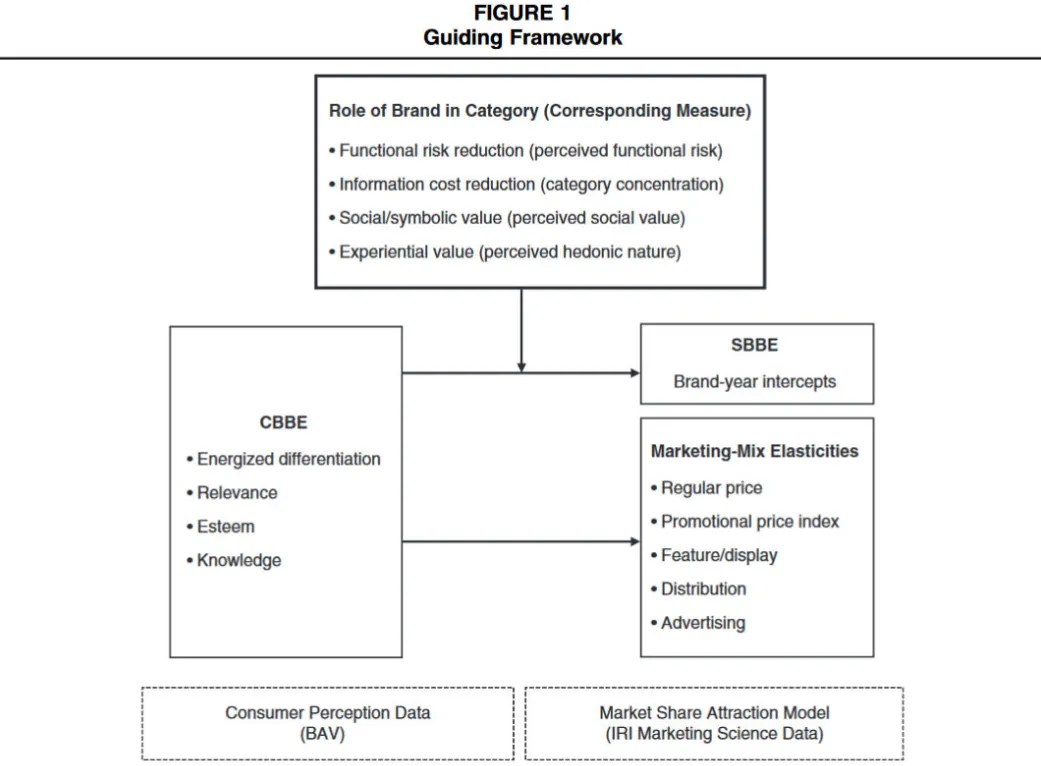
Datta, H., Foubert, B., & Van Heerde, H. J. (2015). The challenge of retaining customers acquired with free trials. Journal of Marketing Research, 52(2), 217-234.
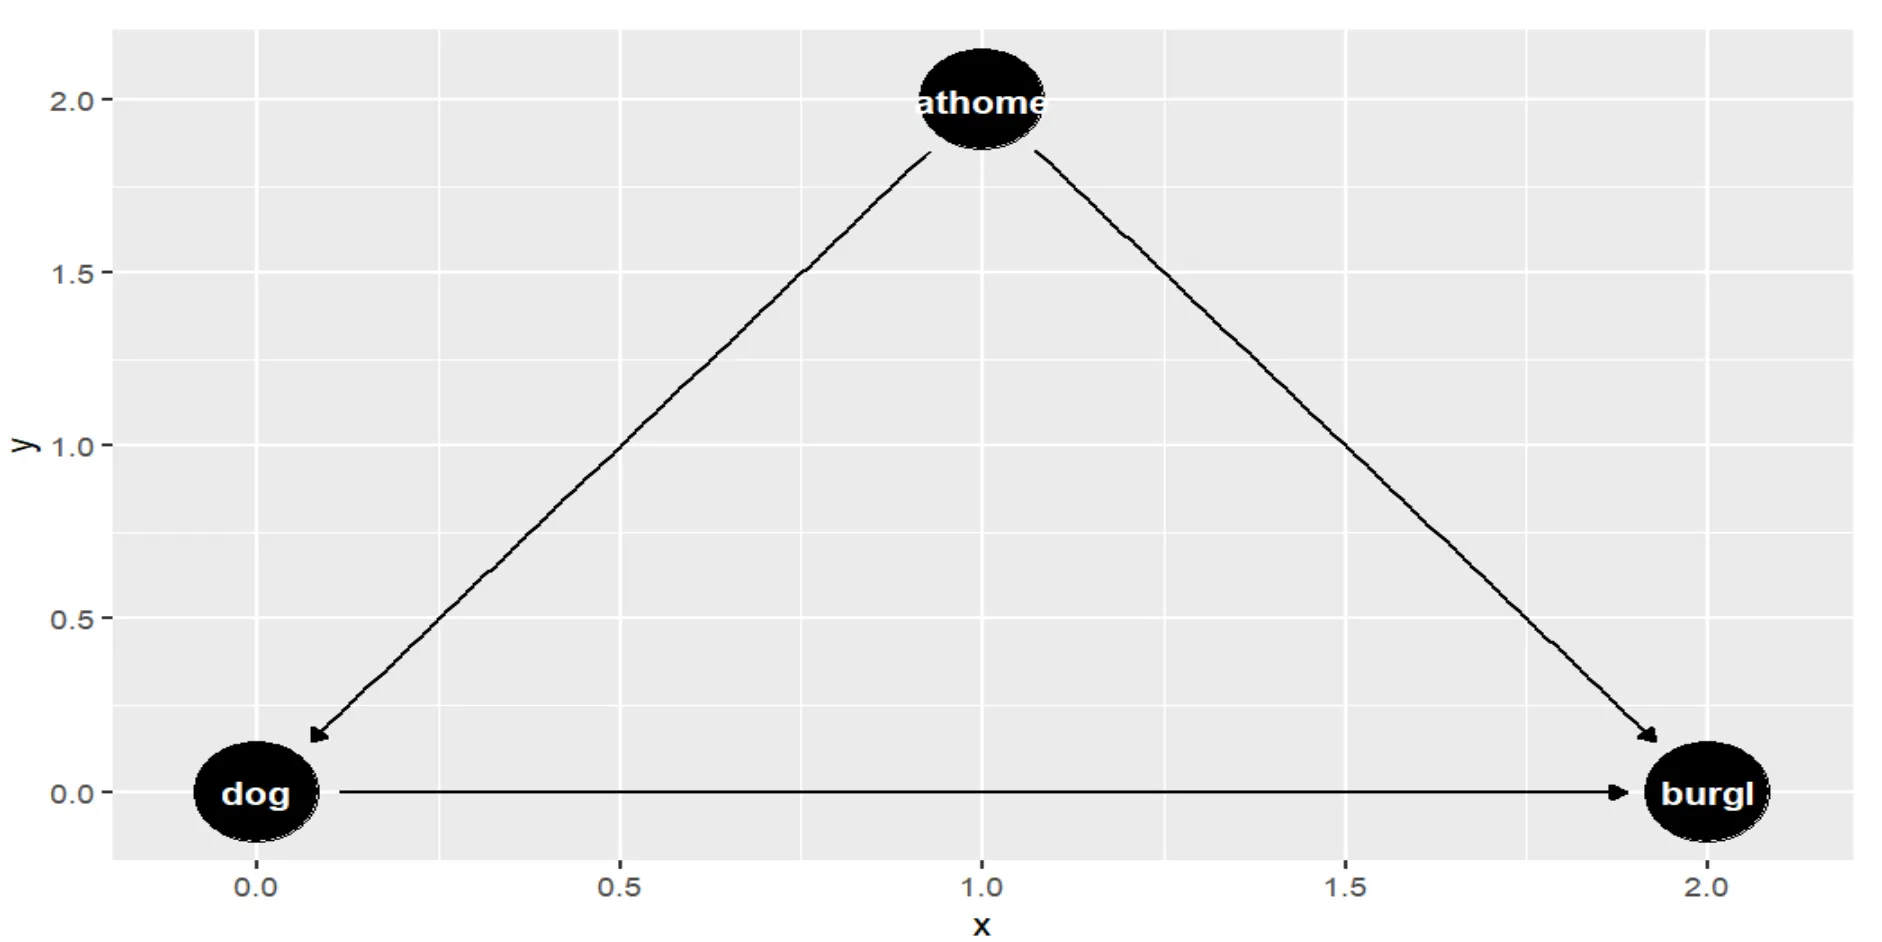
Causal diagram
A causal diagram can help to clarify which covariates are relevant and in which way they relate to the main variables (moderators/confounders). Causality specifies the direction of the effect, you are looking for more than just correlation, which is usually what research questions in economics-related fields are about.
Below is an example of a causal diagram created using R, illustrating the causal relationship between owning a dog and the likelihood of experiencing a burglary. There is the confounding factor of being at home often.

#load packages
library(dagitty)
library(ggdag)

causaldiagram <- dagitty('dag{
                dog [pos="0,0"]
                burgl [pos="2,0"]
                athome [pos="1,2"]

                dog <- home -> burglary
                dog -> burglary
                }')

ggdag(causaldiagram) #plot causal diagram
Hypothesis or expectation
If you have a strong theory, you can cleanly predict what happens to Y if you change X. In that case, it makes most sense having formal hypotheses in your paper. For example, see Datta, Foubert and van Heerde (2015, JMR, https://doi.org/10.1509/jmr.12.0160 )
If your theory is not strong, or your predictions are frequently going in both ways (e.g., both positive and negative), it is better to keep it to expectations, rather than writing out hypotheses. An example paper having expectations is Datta, Ailawadi , and Van Heerde (2017).
Alternatively, a paper can very well do without any hypotheses or expectations. See the example of Datta, Knox, and Bronnenberg (2018).
The most important thing is that you choose a format that fits your research!
Data
In this chapter, you explain which data you use and what you do to construct your estimation sample. Put additional details into an appendix or the online appendix. Provide meaningful summary statistics that are closely related to the analysis you will do. Spend time on thinking what is really relevant for the reader.
The Data chapter typically consists of the following parts: - Description of data collection and raw data - Data preparation: raw to final data - Descriptive statistics of the final dataset
1. Description of data collection and raw data
Describe how the raw data was stored, or how you gathered it yourself (e.g. with webscraping or APIs).
-
The primary key: this is the unique identifier for each entity within the dataset. For instance, in analyzing YouTube views per video, the primary key might be "video_id - day". Similarly, when analyzing income distribution across households, the primary key could be a "household ID".
-
Frequency: This specifies the interval or frequency at which data is recorded - whether it's every 5 years, annually, monthly, daily, or at a finer granularity like minutes or seconds.
-
Value columns: These columns hold data recorded per primary key. For example, YouTube views per video or economic attributes such as income levels and demographic details of households.
Summary statistics for raw data
A descriptive statistics table with mean, standard deviation, minimum, and maximum per variable is essential.
2. Data preparation
Before analyzing the data, cleaning and transforming the raw data is necessary. Typical things to include about the data preparation are: - Refinement of sample: Describe how you refined or filtered the dataset, specifying inclusion or exclusion criteria. - Explain your approach to handle missing values and outliers - Aggregate your data: E.g. converting monthly data to yearly. - Data merging: Integrating data from different sources into one dataset that contains all the variables you need for analysis.
-
Operationalization of variables: Define the variables to be used and illustrate how certain variables were computed or transformed. Provide a table if necessary.
TipLook into existing literature to see how previous researchers have defined variables that you are looking for.
3. Descriptive statistics of the final dataset
Present a table of summary statistics of the final dataset, including key metrics per variable. Also, provide plots to visualize and highlight interesting trends or aspects. Even before model estimation, you can highlight a certain trend between two variables.
TipThe Data visualization building block teaches the best practices.
Method
Write this section such that a graduate student with general training could run the analysis if you give him the data. Typically, you will describe your model in a formula, and an accompanying text. Draw inspiration from existing literature on this particular research method and how to define it. Pay attention to the correct sub indices!
Regression models
For regression models, there are some good resources at Tilburg Science Hub to help you in the analysis and model selection:
-
The basics of regression analysis: A building block on how to estimate a model with regression analysis and make predictions on the relationship between variables.
-
Regression with panel data: A series that includes several methods for panel data analysis, and helps you to choose between a fixed and random effects model.
- An introduction to Instrumental Variable regression
- An introduction to Difference-in-Difference analysis
- A series on Regression Discontinuity Design
- An introduction to the Synthetic Control Method
Results
Think hard about how to present and discuss the results. Make a careful selection. For each table and figure, ask yourself what exactly it is meant to convey to the reader.
Results table
Report your estimation results in a table. Don't just copy this from your statistical software. You might want a table combining multiple models or making other adjustments, e.g. like adding fit metrics to the table, or deleting controls not relevant to mention.
Learn here how to create a ready-to-use LaTeX regression table in R.
Metrics about the model
Also report appropriate metrics about your model such as the R-squared, adjusted R-squared, F-test (for regressions), log-likelihood test (for Logit models), and any validation conducted on a holdout sample.
If you've explored competing models, showcase the fit statistics for each model and provide reasoning behind your final model selection.
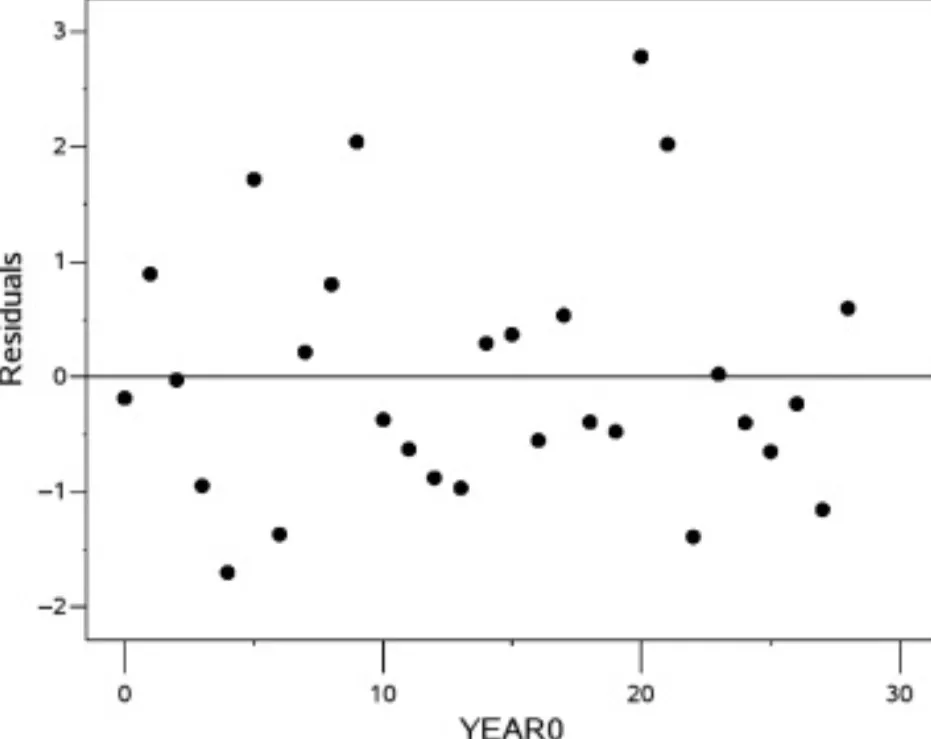
Diagnostic plots
Think about adding a diagnostic plot to serve as a visual tool to assess the adequacy and assumptions of the model fit. Which kind of plot really depends on your type of model.
An example for a linear regression model is a residual plot. Here, the independent variable is YEAR0 = (year-1990) and the residuals represent the expected temperature for the year 1990. A random scatter of points indicates that the residuals are independent and identically distributed (i.i.d.) and the assumption holds.
Explain your results
For each hypothesis tested in the study, follow these steps to report the findings: - Restate the hypothesis briefly. - Report the obtained result within brackets, including the coefficient and the significance level. For example, "The effect of A on B is statistically significant (β = xx, p = .012)" or "A increases B by x% (β = xx, p = .025)". - Explain the result: - For confirmed hypotheses, provide reasoning that reinforces your hypothesis. For instance, "As hypothesized, A leads to B because..." - For unconfirmed hypotheses, elaborate on this as well. It could be due to conceptual reasons (if the effect might not exist, provide arguments), measurement issues, or other relevant factors impacting the expected relationship. - Discuss the impacts of control variables. For example, "Control variables like age and gender exhibit observable effects. For instance, age positively influences the intention to purchase (β = xx, p = .12). However, education does not significantly predict intention to purchase (β = xx, p = .63). This lack of significance might be due to..."
TipExact p-values
Report the exact p-values in the text and tables. For example, p = 0.049 instead of p < 0.05. Also, the p-value needs to be written in italic.
Visualize your results
Consider plotting some results, e.g. relevant coefficients of your estimated models.
Discussion
- Start by giving a concise summary of your main findings. You can also have a summary table with your results (e.g., hypotheses/expectations, confirmed/not confirmed, etc.).
- Discuss the implications of your findings. Elaborate on how the results challenge existing theories and their real-word implications for relevant stakeholders. Provide theoretical and managerial takeaways, or policy recommendations that elucidate the practical relevance of your research findings.
- Address the limitations in your research design. This demonstrates a nuanced understanding of the study's scope and potential constraints.Try to address all the concerns people may have. Don't be too defensive, but stay honest.
- You can include some robustness testing, where you examin the reliability of the results by conducting various sensitivity analyses or alternative methods.
- Suggest possibilities for future research based on the identified limitations or unanswered questions arising from your study.
Conclusion
- Briefly mention the main takeaways and their interpretations. Emphasize the significance of these findings in addressing the research objectives.
- Summarize any policy or business recommendations stemming from your research findings. Highlight actionable insights derived from the study that could be practically implemented or considered by policymakers or business stakeholders.
References
Learn here how to build and maintain a reference list effectively.
Appendix
The appendix includes supplementary information that supports the main content but might be too detailed or lengthy to include in the main body of the paper.
Online Appendix
The online appendix serves as a repository for additional materials that complement the main content of the document. It's a place for extra datasets, tables, figures, or any information that enhances the understanding of the paper but might disrupt the flow if included within the main body.