


Overview
In any local or virtual machine, monitoring and managing memory allocation is crucial. Regardless of how advanced or powerful your machine might be, there are always potential bottlenecks, especially when working with memory-intensive tasks.
In this guide, we delve deep into:
-
Memory monitoring tools: Learn commands like
htopandnvtopto keep an eye on your system's performance in real-time. -
Strategies for handling memory issues: Learn hands-on strategies to avert memory-related setbacks. We'll also touch upon an example using the BERT model in PyTorch to exemplify how memory can be optimized in machine learning scenarios.
 Tip
TipLinux for Virtual Machines
The commands
htopandnvtopare designed for Linux-based environments (such as Ubuntu or Debian) given their widespread use in virtual machine contexts due to their open-source nature, robust security, and versatility.If you wonder how to set-up a Virtual Machine with a Linux system, go through our building block!
Handling memory allocation issues
It's not uncommon for systems to run out of memory, especially when dealing with large datasets or computation-heavy processes. When a system can't allocate required memory, it can result in runtime errors.
While the straightforward solution might seem to be upgrading hardware, it isn't always feasible. Hence, the necessity to monitor and manage memory efficiently.
Monitor resources usage
A crucial part of managing any computational task is continuously monitoring your system's resource usage. This way, you can promptly identify potential bottlenecks and inefficiencies and address them proactively.
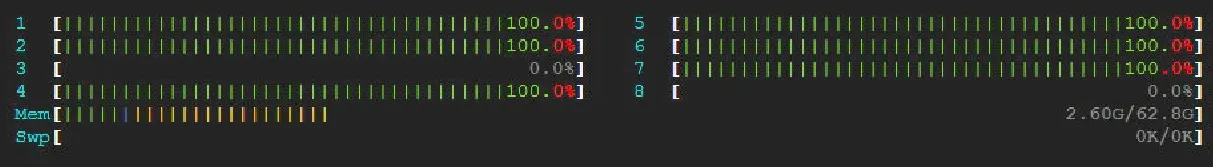
As introduced before, htop and nvtop are two widely used tools for tracking CPU and GPU usage, respectively.
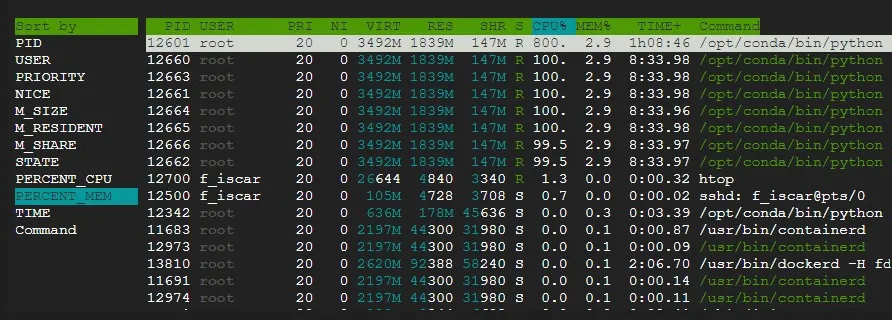
htop is an interactive process viewer and system monitor. It's similar to the top command but provides a more visually appealing and human-readable format.
It allows us to sort by the task we're most interested in monitoring by pressing F6, among other interesting features.
To install htop in your VM instance, you can use the following command:

$ sudo apt install htop
# or:
$ sudo apt-get install htop
You can then run htop by simply typing htop in your terminal.
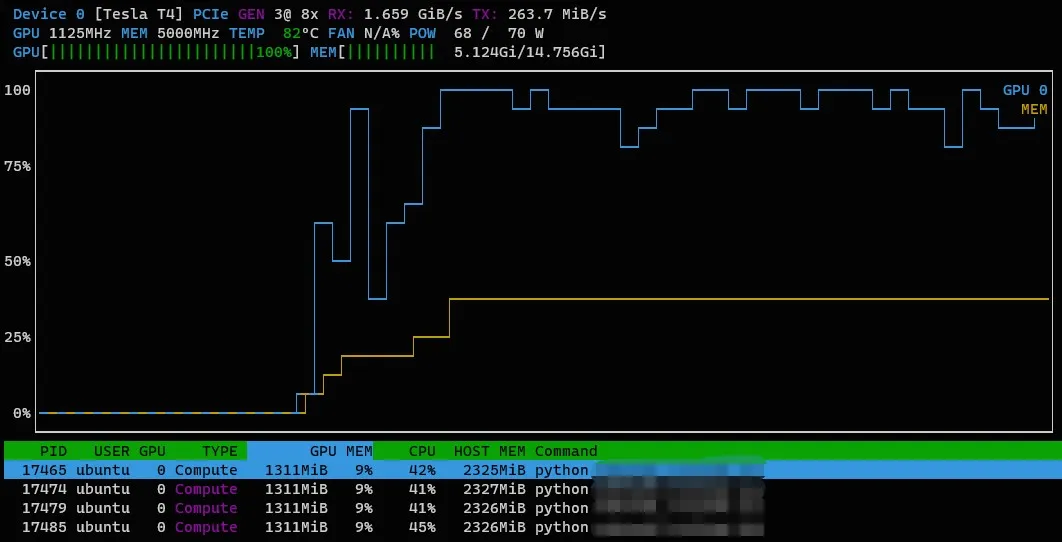
Similarly, nvtop stands for NVIDIA GPUs TOP. It's an interactive NVIDIA GPU usage viewer for Unix-like systems, including Ubuntu, and it's a must-have tool for anyone using GPU-accelerated tasks.
You can install nvtop using the following commands:
$ sudo apt install nvtop
# or:
$ sudo apt-get install nvtop
With nvtop, you can monitor GPU usage by typing nvtop into your terminal.
Use htop and nvtop to keep an eye on your resource usage. If you notice your system is running out of memory or your GPU utilization is too high, it's a good idea to take steps to address the issue before it leads to a crash.
 Warning
Have a back-up
Overloading system memory can lead to unsaved data loss. Regularly save your work during memory-intensive tasks.
Practical approaches
There are several practical solutions to avoid running out of memory. These are some common strategies:
- Batching: When working with large datasets, especially in machine learning scenarios, it's efficient to break the task into smaller chunks. For demonstration purposes, we'll use a BERT model in PyTorch. BERT is a large neural network model that can easily consume memory, making it a good example for this discussion.
In PyTorch, the DataLoader class facilitates batching:
 Example
An illustration of creating a DataLoader for a text dataset, using a tokenizer for a BERT model, is shown below:
  from torch.utils.data import Dataset, DataLoader

  class TextDataset(Dataset):
      def __init__(self, texts, tokenizer, max_length):
          self.texts = texts
          self.tokenizer = tokenizer
          self.max_length = max_length

      def __len__(self):
          return len(self.texts)

      def __getitem__(self, idx):
          text = self.texts[idx]
          encoding = self.tokenizer(
              text,
              max_length=self.max_length,
              padding='max_length',
              truncation=True,
              return_tensors='pt'
          )
          return encoding

  # Create Dataset instance
  dataset = TextDataset(full_df['commenttext'].tolist(), tokenizer, max_length)

  # Configure your batch size according to your hardware resources
  batch_size = 32

  # DataLoader parameter shuffle is set to false by default to avoid mixing values
  dataloader = DataLoader(dataset, batch_size=batch_size)

  # Change path to read the saved models from data/Labeled_Responses/Models

  # Load model
  bert_sc_pa = BertForSequenceClassification.from_pretrained(
      dir +'/model_BERT_pa1')

  # Inference
  bert_sc_pa.eval()
  predictions_pa = []

  with torch.no_grad():
      for batch in dataloader:
          input_ids = batch['input_ids'].squeeze()
          attention_mask = batch['attention_mask'].squeeze()

          output = bert_sc_pa(input_ids=input_ids, attention_mask=attention_mask)

          scores = output.logits
          predicted_pa = torch.argmax(scores, dim=1).cpu().numpy()
          predictions_pa.extend(predicted_pa)
Adjusting the batch_size parameter balances memory usage against processing time. A smaller batch_size reduces memory usage but may increase processing time.
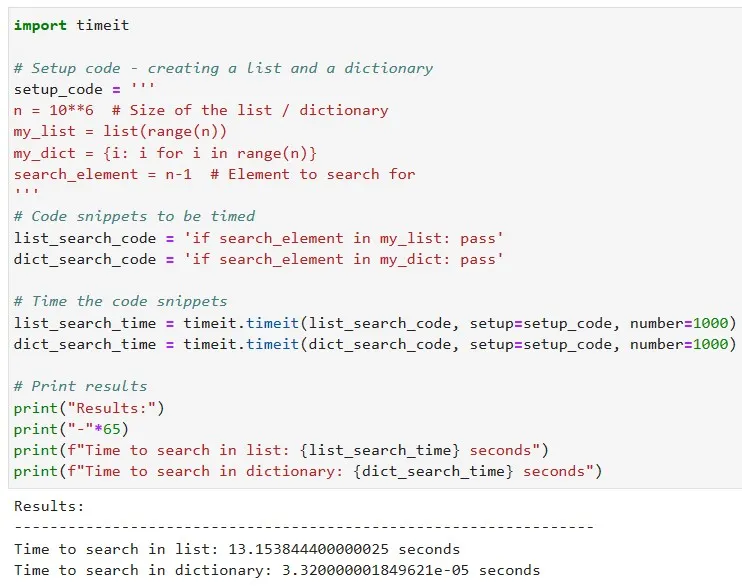
- Efficient Data Structures and Algorithms: A wise choice in data structures and algorithm design can substantially cut down memory usage. The selection depends on your data's nature and your go-to operations.
ExampleTake hash tables as an example, they boast constant time complexity for search operations, becoming a superior option for substantial datasets.
In Python, this translates to choosing dictionaries over lists when wrestling with large datasets:
- Parallelizing your Work: Divide the task among multiple identical instances, each running a part of the code. This approach is particularly useful when your code involves training or using multiple machine-learning models. For instance, instead of running three BERT models sequentially on one instance, distribute them across three instances.
Remember that beyond these strategies, it's always possible to leverage the scalability and flexibility of cloud services such as Google Cloud. These services allow for a dynamic allocation of resources according to your needs.
 Summary
-
Memory Management:
- Monitor with
htop(CPU) andnvtop(GPU). - Implement batching, efficient data structures and algorithms, and use job parallelization to handle memory issues.
- Monitor with
Additional Resources
- Google Cloud Memory-Optimized machines
- Memory management Python Documentation
- Machine type recommendations for VM instances
- BERT GitHub repository