


Overview
Make is a useful tool for automating the execution of scripts and managing datasets in a complex project. However, diagnosing errors in the workflow can be challenging with make. To address this issue, the debugger remake can be used to provide extensive error information, facilitating the debugging process and helping to ensure that the project runs smoothly.
Hence, in this building block, you will:
- Learn how to install and run
remake. - Understand the importance of
remakein debuggingmakefiles. - Get hands-on with debugging sessions, setting breakpoints, and error tracing.
Steps to debugging
To illustrate the steps to debugging with remake we will use an example workflow with the following directory structure.
To immerse yourself in hands-on learning, feel free to clone the provided repository to your local machine and follow along with our example:
bash
├── Airbnb data.Rproj
├── README.md
├── data
│   └── listings.csv
├── gen
│   ├── output
│   │   ├── ordinary_hosts.html
│   │   ├── plot_nrreviews.png
│   │   ├── plot_rating.png
│   │   ├── review_IR.html
│   │   ├── review_IR2.htm
│   │   ├── review_model.html
│   │   ├── super_hosts.html
│   │   ├── tobit1.html
│   │   └── tobit2.html
│   └── temp
│       ├── cleaned_listings.csv
│       └── cleaned_listings1.csv
├── makefile
├── report
│   ├── report.Rmd
│   └── report.html
└── src
    ├── analysis
    │   ├── Rplots.pdf
    │   ├── analysis.R
    │   └── makefile
    └── data-preparation
        ├── cleaning.R
        ├── download_data.R
        └── makefile
Suppose the files cleaned_listings.csv and cleaned_listings1.csv were created after running the cleaning.R script were not saved in the temp folder. The files in the output folder are dependent on these files in the temp folder which will result in an error while executing make.
Here are the key steps we will take you through to debug using remake:
- Install
remake - Run
remake - Use the
remake --tracecommand to run theremaketool with tracing enabled for more details on how each rule in yourmakefileis executed. - Set breakpoints using the
continueorbreakcommand to pause the execution of yourmakefileat specific points to debug.
Now, let's get started!
Installing remake
Debian/Ubuntu
On Debian systems, remake can be installed by running:

$ sudo apt-get install remake
MacOSX
On OSX systems, it can be installed from Homebrew or MacPorts.
$ brew install remake
 Tip
TipHaven't installed Homebrew yet? Check out our Python for webscraping building block to set it up!
Windows
For Windows users, installing remake for debugging Makefiles requires some additional steps, as remake is primarily designed for Unix-like operating systems.
1) Install a Windows Subsystem for Linux (WSL):
WSL allows you to run a Linux distribution alongside your existing Windows installation.
Ubuntu is one of the most common ones, go to the Microsoft Store here, install it and launch it, and you'll be running a Linux shell on your Windows machine.
2) Update your Linux Distribution:
Run the following commands in your Linux shell:
sudo apt update && sudo apt upgrade
3) Install remake:
Now you can install remake as explained before for Ubuntu/Debian systems.
4) Access your project files:
In WSL, your Windows file system is mounted under /mnt/. So, for instance, if you have files on your C drive, they will be accessible under /mnt/c/.
Navigate to your project's directory (which is in your Windows filesystem) from within WSL. For example, if your project is in C:\Users\YourUsername\Projects, you can access it in WSL with:
cd /mnt/c/Users/YourUsername/Projects/Tracing
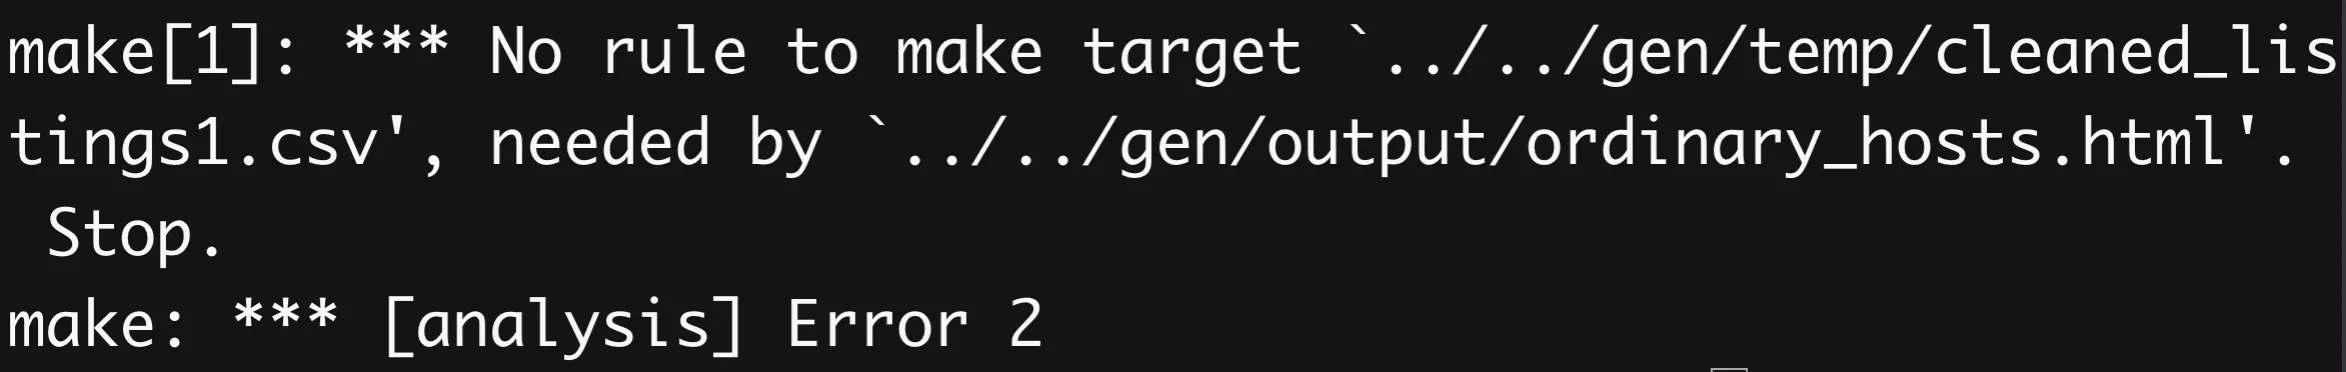
When you run make, it simply spots the error without further information on how the target needs to be updated but we might get more information by consulting the rules for the target.
Now let us run remake:
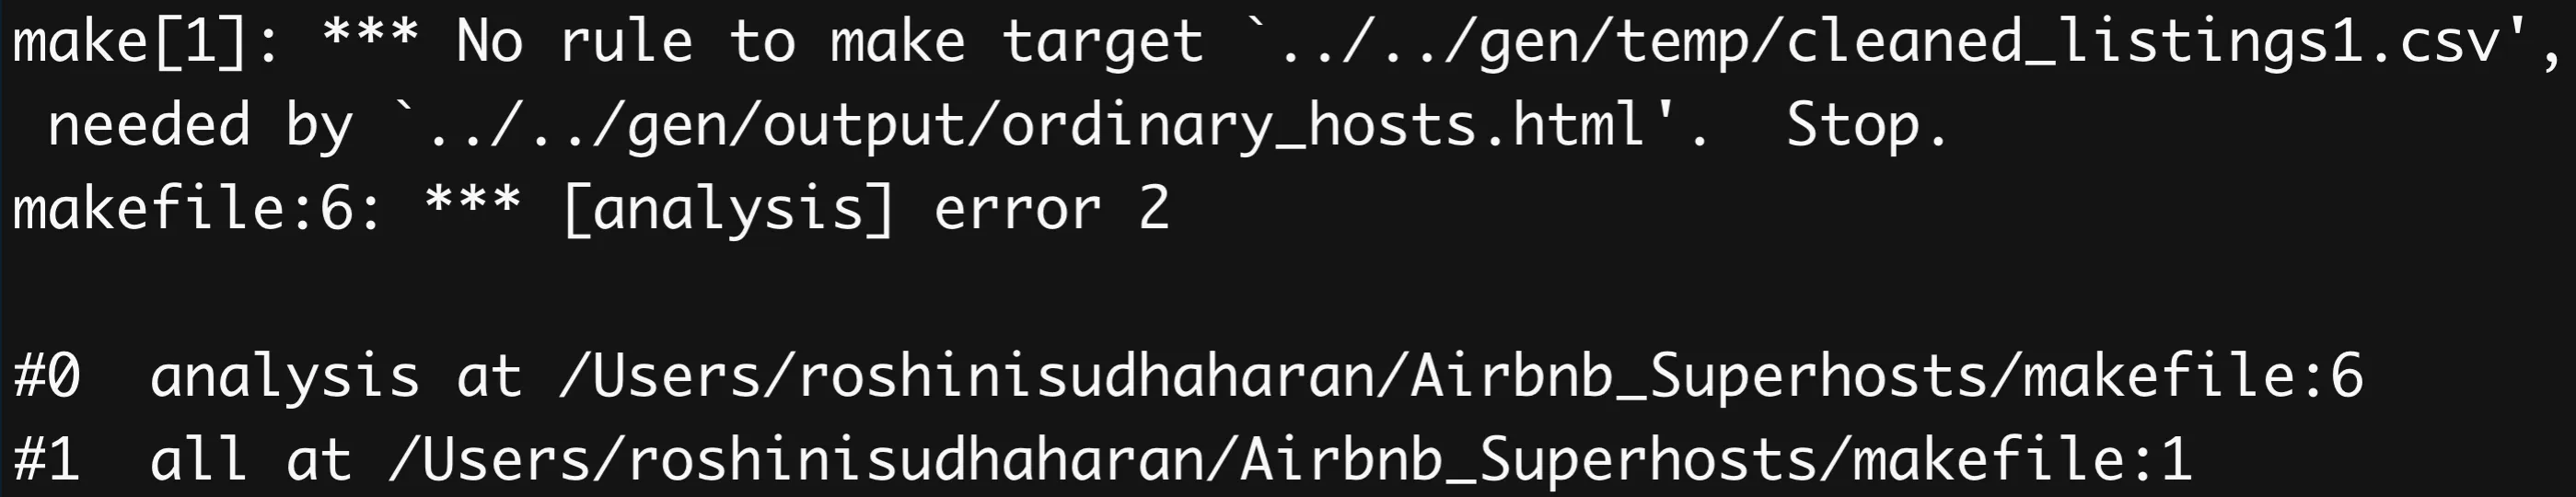
This displays additional information. We get the line number inside the Makefile for target analysis (6) and the target that got us to this one.
For further traceback information, run:
remake --trace analysis
Or, without the target name:
remake --trace
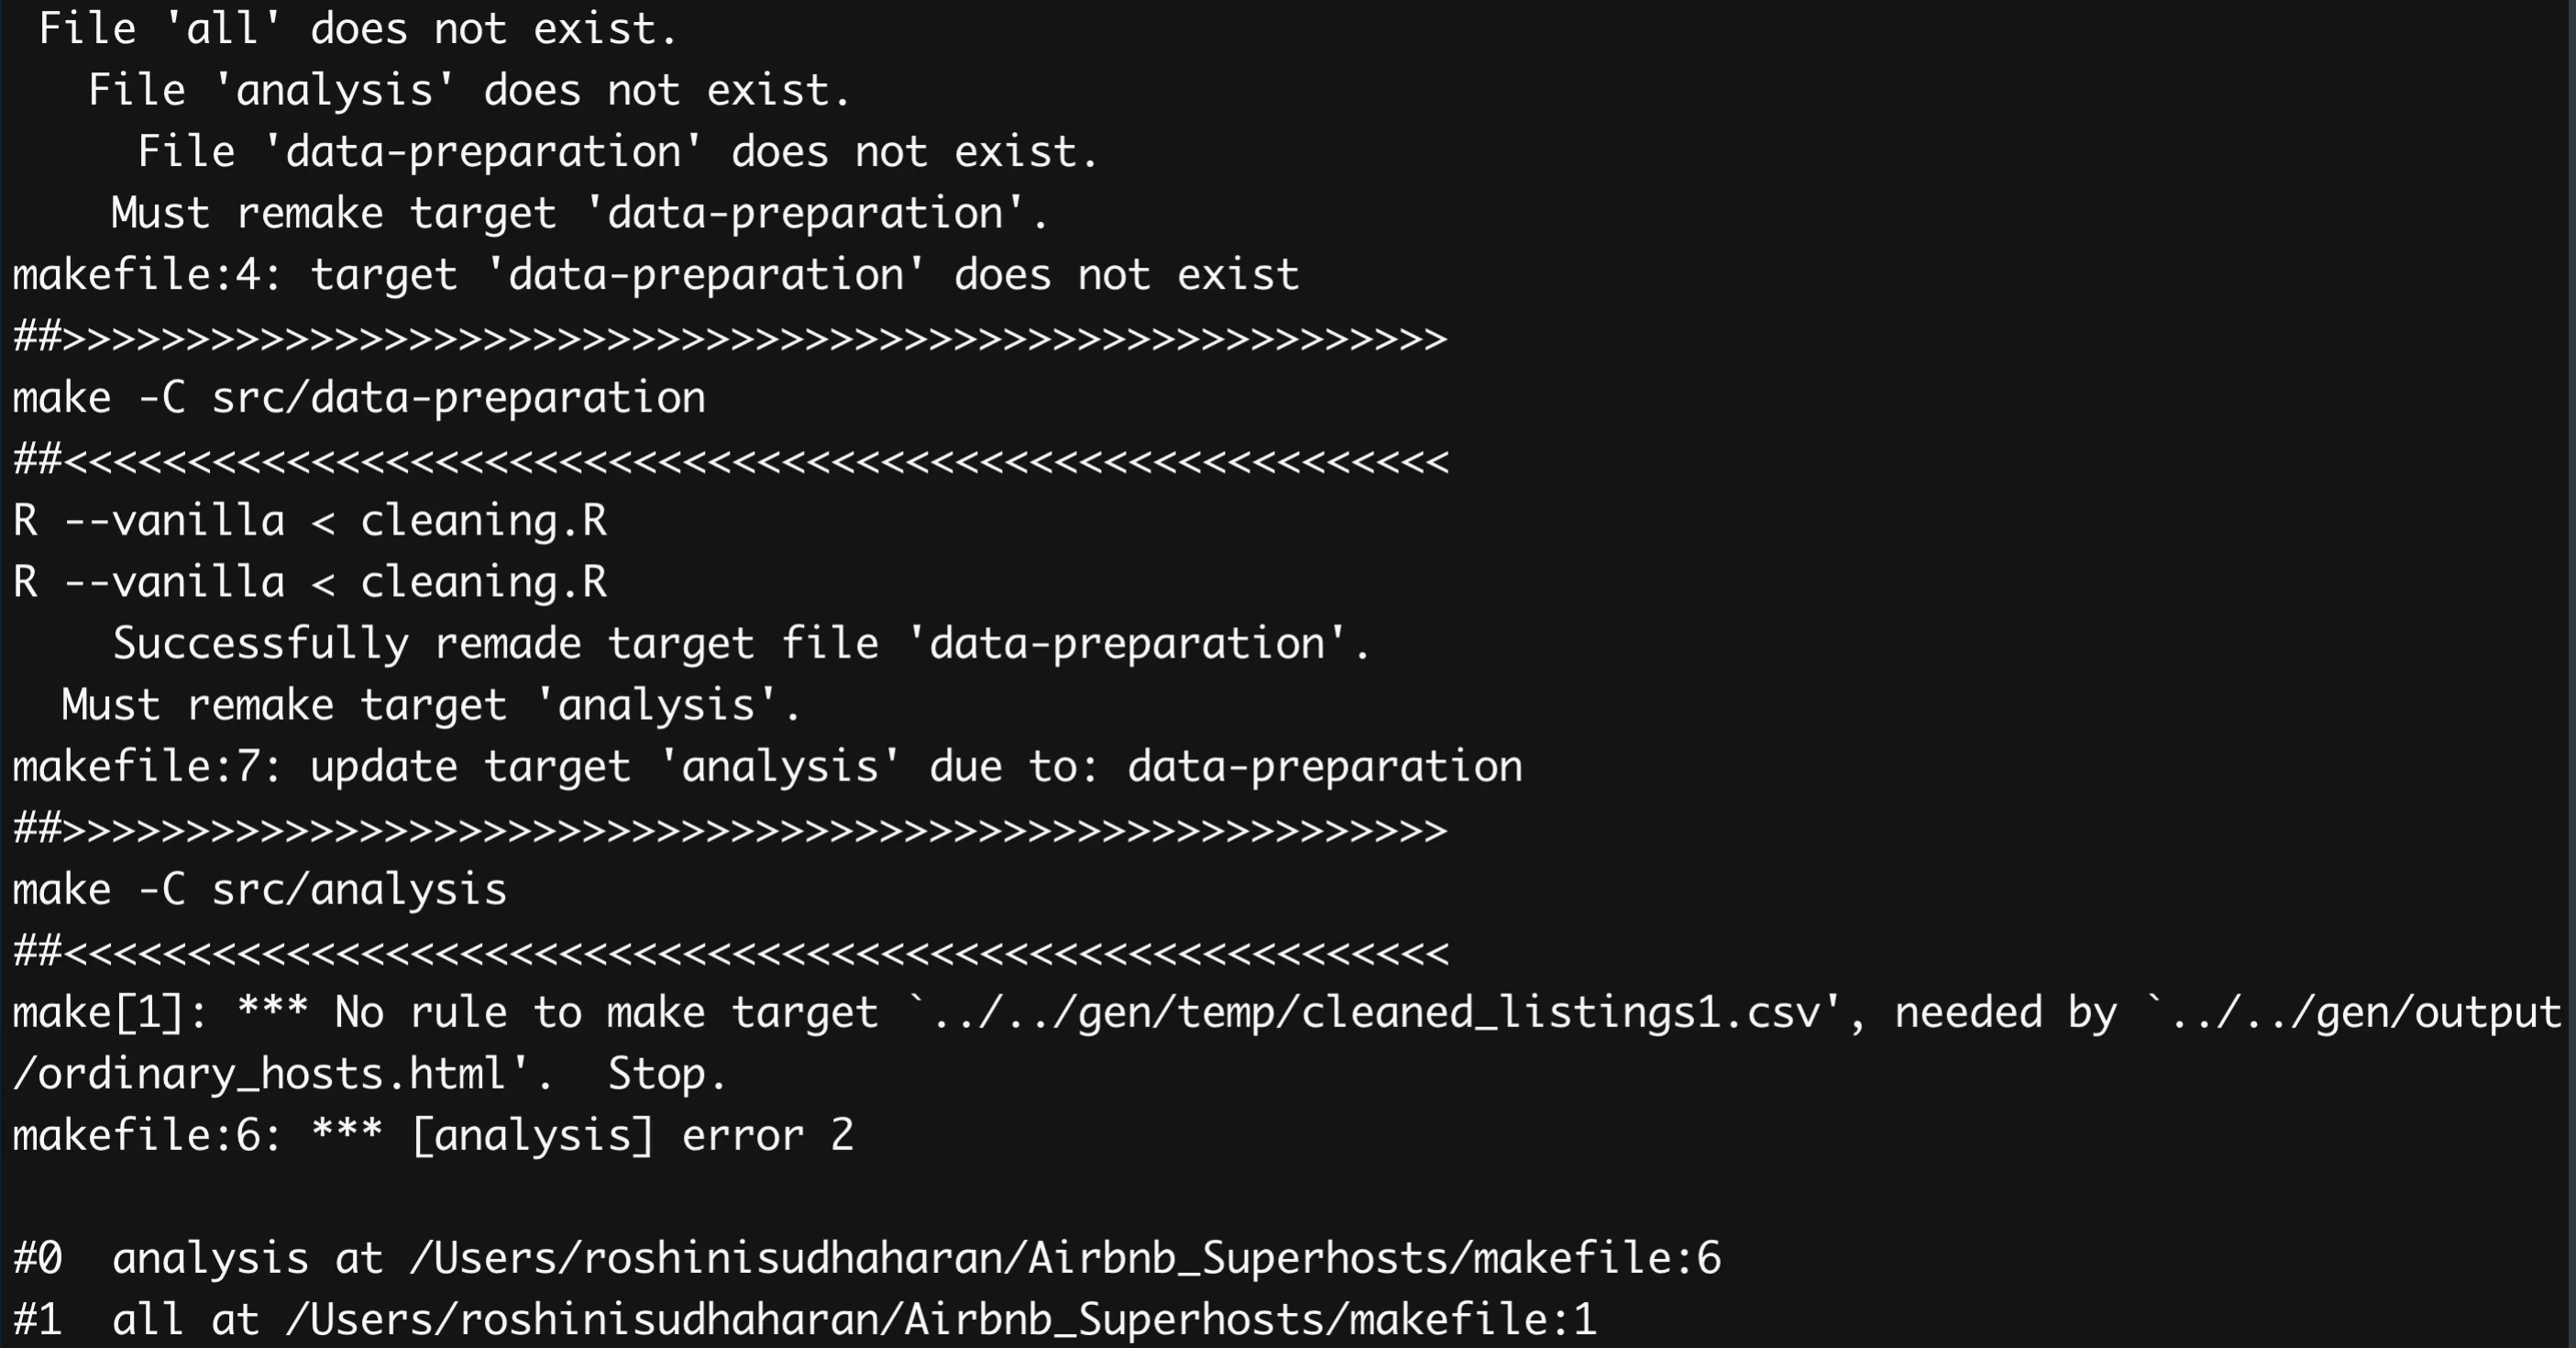
The indentation in the first few lines containing file name and line numbers gives target level nesting. The target data-preparation was asked to be remade because it is a dependency of target analysis Thus, we get the dependency nesting as build and traverse the tree.
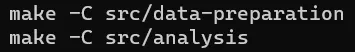
Finally, we also get details on the scripts that were run to build the target data-preparation. This tells us to check the cleaning.R script for bugs.
TipRun remake -n to see the sequence of steps that will be run to execute the workflow without actually running it.
Entering the Debugger and Setting Breakpoints
The simple tracing method explained above is sometimes enough but we could also work with the built-in debugger which contains some useful commands for more efficient debugging.
Run remake --debugger , remake -X or remake --debugger analysis (with a specific target name, here: analysis) to enter the debugger.
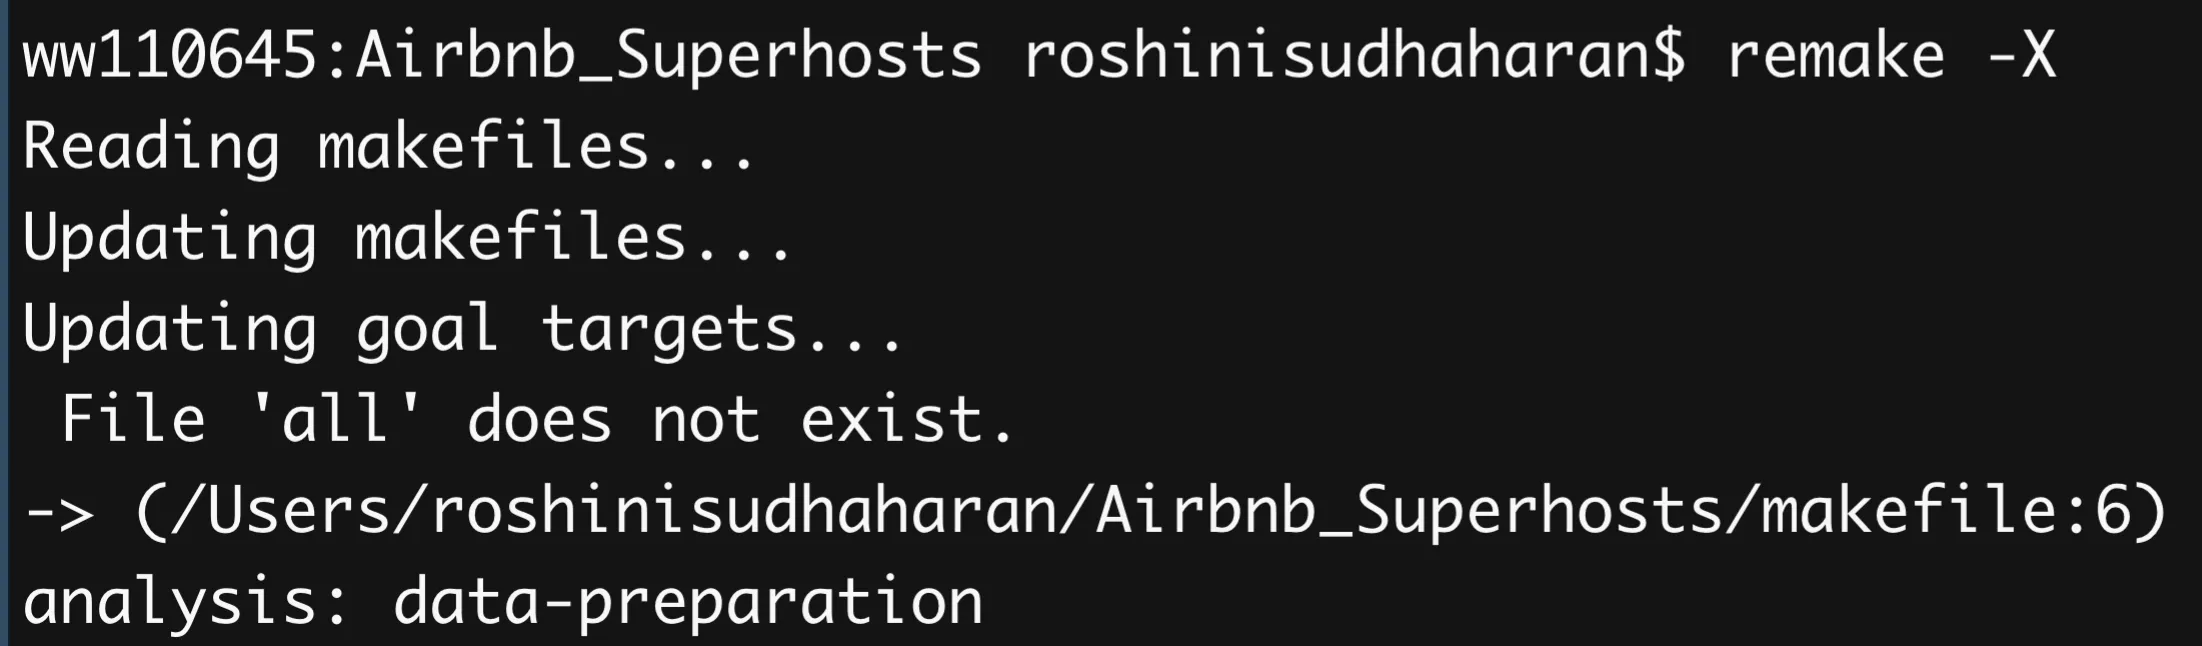
It first checks whether the Makefile itself is up to date. Now that we have initiated the debugger we can set a breakpoint and run until the dependent target. The debugger assigns a number to each breakpoint created. We could also set a breakpoint using a line number instead of a target name. Both continue and break commands can be used to set breakpoints.
For a given target, there are three main stopping points:
- Before target prerequisite checking: prereq
- After target prerequisite checking but before running commands: run
- After target is complete: end
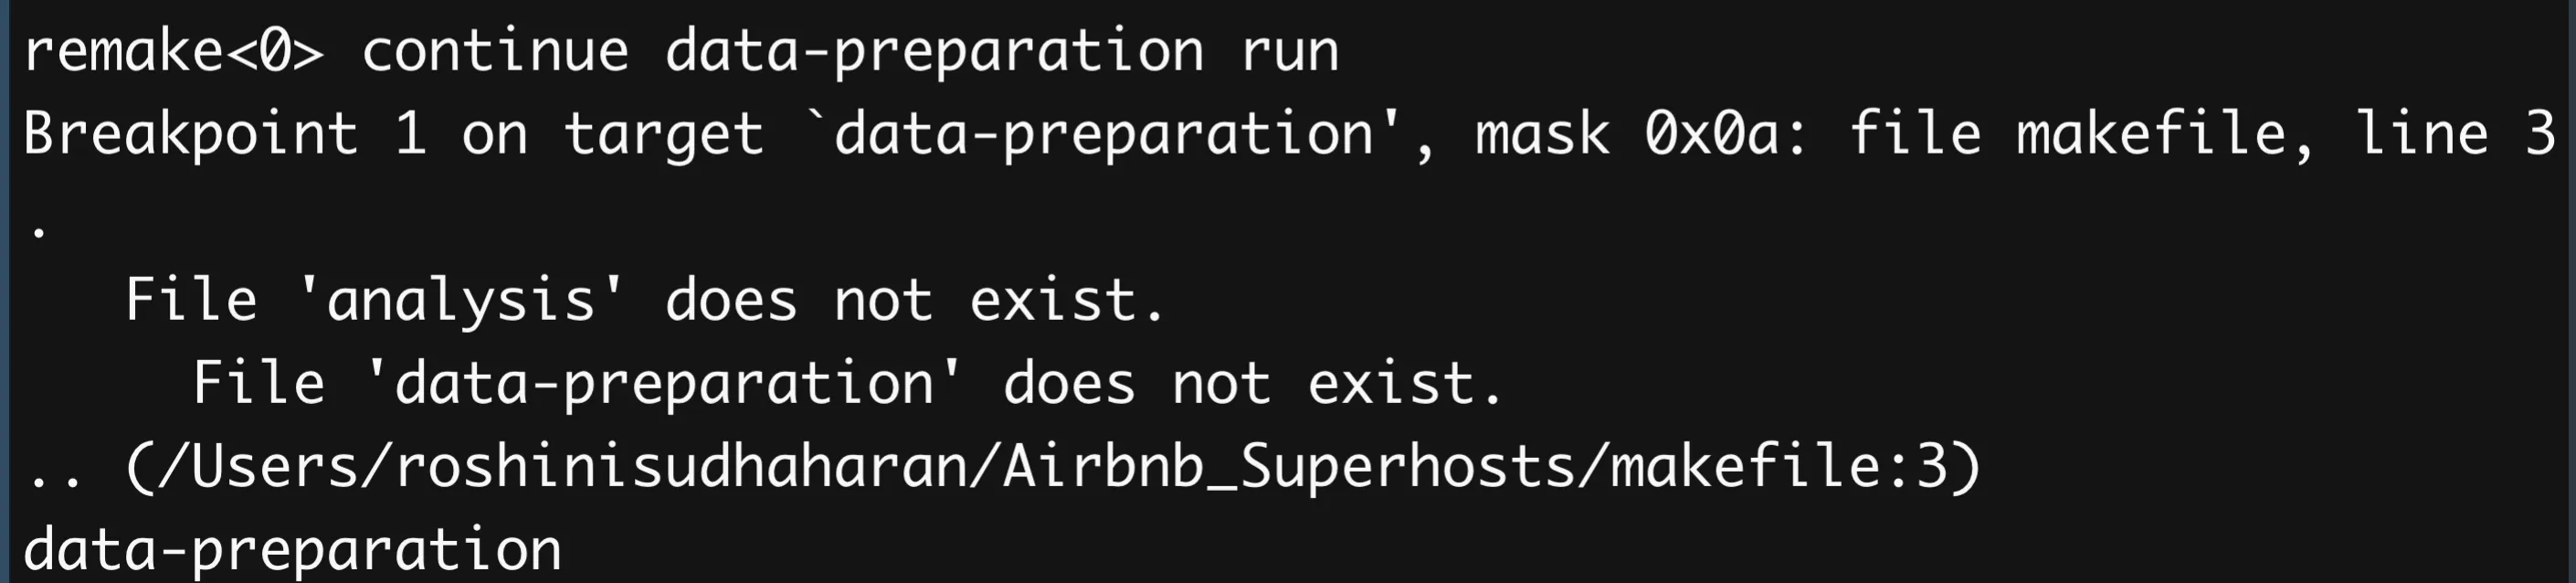
Adding run to the end of continue data-preparation causes the debugger to stop after dependency checking. This is the default option. Previously, the debugger stopped before dependency checking , as shown by the icon ->, so it lists the dependencies for the target.
Here, the dependency for the target ‘analysis’ was ‘data-preparation’. Later, the debugger stopped after dependency checking, as shown by the .. icon rather than ->.
Furthermore, you can run break to get a list of all breakpoints. To delete breakpoints, run delete with the breakpoint number.
TipClick here for more information on the debugger syntax
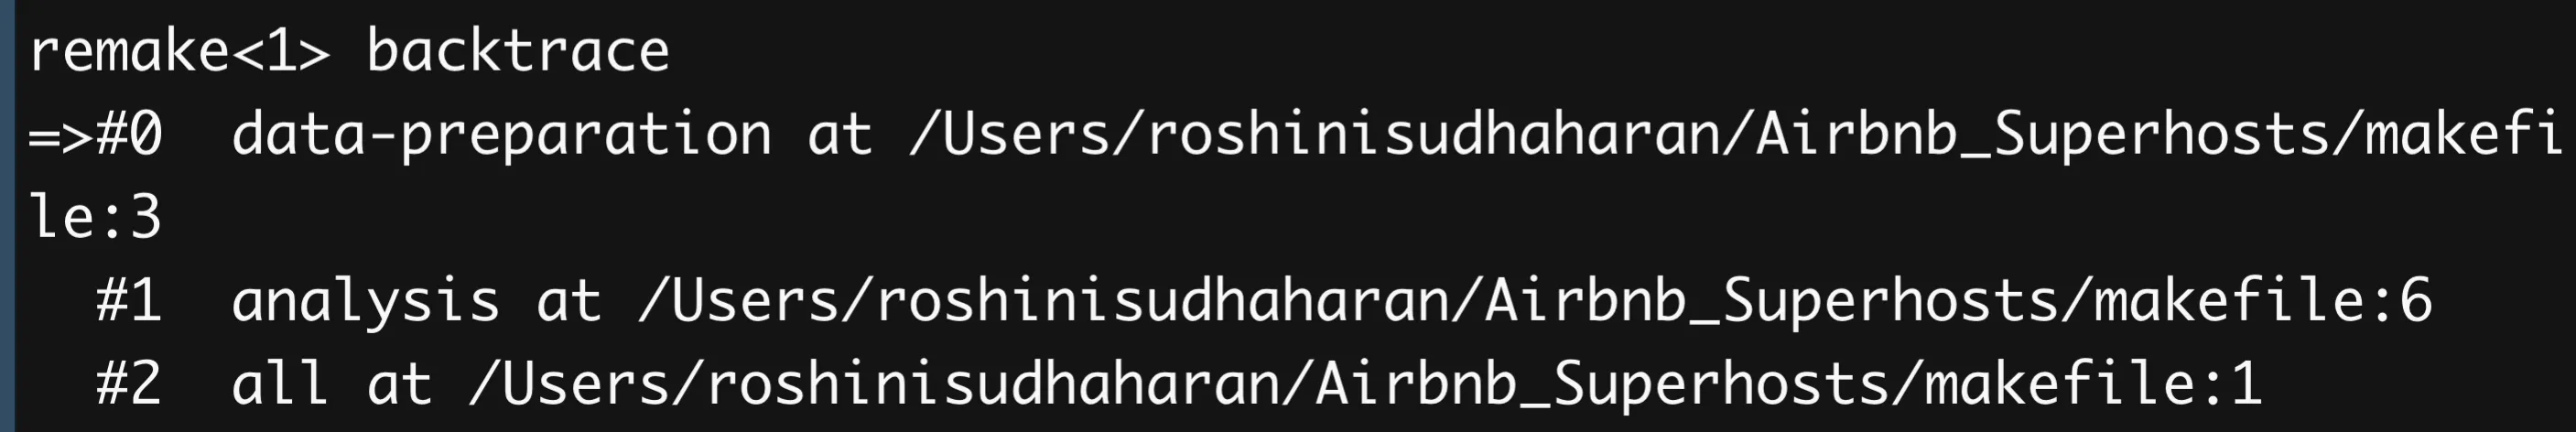
Additionally, once you enter the debugger the backtrace command comes in handy to trace the root of the error.
TipClick here for a complete list of debugger commands.
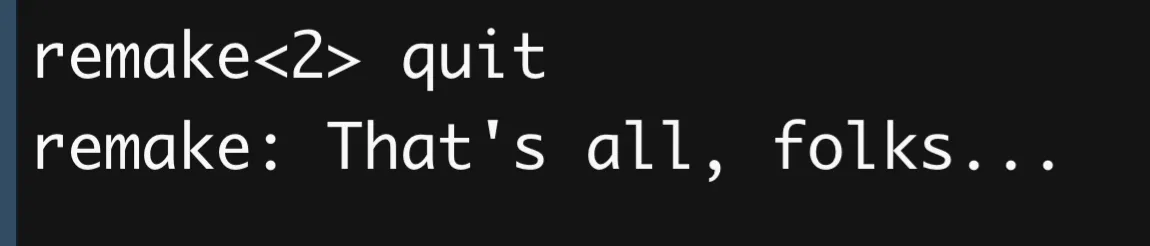
Lastly, to exit the debugger session simply run quit.
TipThe following changes have been made to GNU Make to improve tracing and error reporting with remake:
- The
Makefilename and the line inside this file are reported when referring to a target. - A list of relevant targets with their locations is shown in the error message.
- The command invocation used to run
makeis also shown. - There are useful options that allow for entering the debugger on error.
 Summary
Remakeis a debugger tool used for diagnosing errors in themakeworkflow, providing extensive error details and ensuring smoother project operations.
This building block provides a comprehensive guide on:
- Installing remake on various platforms (Debian/Ubuntu, MacOSX, Windows).
- Using remake for tracing errors, initiating debugger sessions, setting breakpoints, and backtracing to locate errors' roots.