Overview
The next topics will explain various models commonly used to analyze panel data. Each of these models have their own strengths and assumptions and the choice of an appropriate model depends on the specific research question and the underlying assumptions that hold for the panel data set at hand. This series of articles aims to provide guidance in choosing the most suitable model for your analysis!
The following models will be discussed: - Pooled OLS - First-difference estimator - Within estimator (Fixed effects) - Between estimator - Random effects
We start with the Pooled OLS model in this topic!
Pooled OLS Model
The Pooled OLS model applies the Ordinary Least Squares (OLS) methodology to panel data. This model assumes that there are no unobservable entity-specific effects, meaning that all entities in the data set are considered to have the same underlying characteristics. Consequently, $\alpha_i$ is assumed to be constant across individuals and there is no dependence within individual groups (firms).
By assuming no dependence across individual groups, Assumption 1 of the Fixed Effects Regression Assumptions holds, which states that the error term is uncorrelated with the independent variables. Estimating the Pooled OLS model obtains unbiased estimates of the regression coefficients, under the condition that the other assumptions of the OLS model are satisfied.
The model with Grunfeld data
The model can be represented as follows:
$invest_{it} = \beta_0 + \beta_1 value_{it} + \beta_2 capital_{it} + \epsilon_{it}$
where,
- $invest_{it}$ is the gross investment of firm i in year t
- $value_{it}$ is the market value of assets of firm i in year t
- $capital_{it}$ is the stock value of plant and equipment of firm i in year t
- $\epsilon_{it}$ is the error term
The model pools observations together from different time periods, ignoring they belong to specific firms. As a result, all observations are treated as if they come from a single group, effectively combining the panel data into a cross-sectional data set. The model coefficients can then be estimated using OLS.
Estimation in R
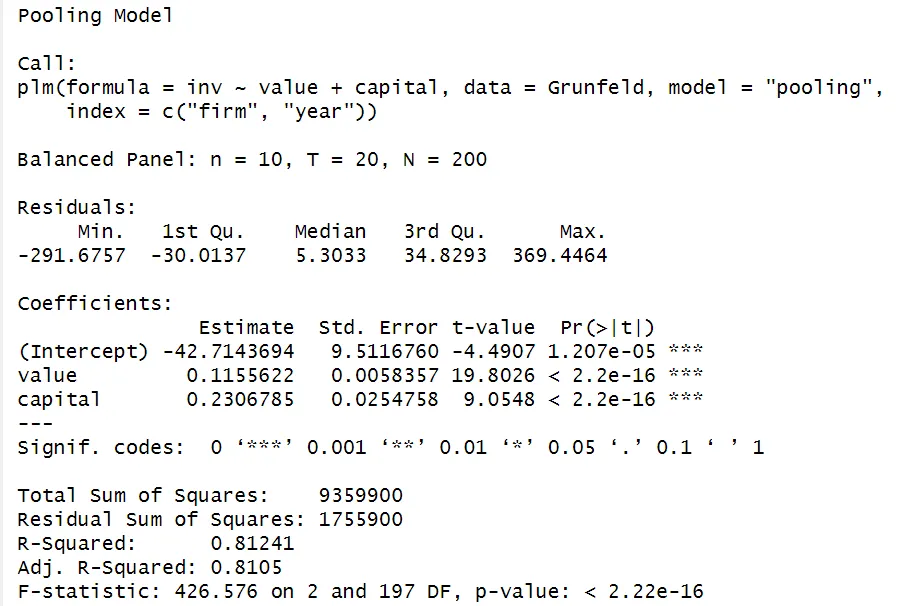
The plm function in R is specifically designed for panel data analysis. To estimate a Pooled OLS model using the plm function, specify the model type as "pooling" within the function.
The index argument specifies the index variables that define the panel structure of your data. Including this is not strictly necessary when the data is already in a default panel data format and the plm function will automatically detect the first column as the entity index and the second column as time index.
# Load packages & data
library(plm)
library(AER)
data(Grunfeld)

# Estimate pooled OLS model
model_pooled <- plm(invest ~ value + capital,
              data = Grunfeld,
              index = c("firm", "year"),
              model = "pooling")

summary(model_pooled)

Since the Pooled OLS model effectively treats the panel data as cross-sectional data by ignoring entity-specific effects, you can also use the function lm and obtain the same results.
 Summary
Pooled OLS is the simplest model to estimate and interpret. However, be careful using it. Panel data without entity-specific effects is very unlikely and the assumption of independence across groups is unrealistic in many cases. Using pooled OLS in the presence of unobserved entity-specific factors can lead to omitted variable bias and produce biased results.


