


Automating Workflows
Up to this point, you should have created the following five R scripts:
 Summary
| File | Description | Phase |
|---|---|---|
download.R | Downloads the data from Inside Airbnb and stores as csv format | Input |
clean.R | Preprocesses the raw data into an aggregated format ready for analysis and visualisation | Transformation |
pivot_table.R | Create a pivot table for the number of reviews by region across time | Transformation |
plot_all.R | Create a line chart for the total number of reviews in a city across time | Output |
plot_Amsterdam.R | Create a line chart for the number of reviews for the top 3 neighborhoods in Amsterdam | Output |
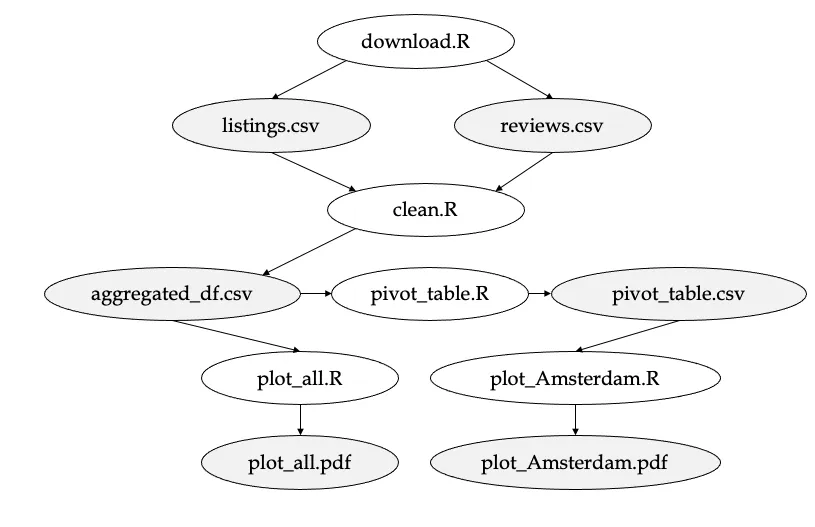
As you've worked through the set of exercises, you've repeatedly built on preliminary results. For example, the plot for the top 3 cities in Amsterdam (plot_Amsterdam.pdf) could only be created once the pivot_table.csv file had been generated. In a similar way, the preprocessing pipeline (clean.R) could only take place once the data (listings.csv & reviews.csv) had been downloaded. These dependencies have been depicted in the figure below.
Revisit the study notes on "Automating your Pipeline" and write a makefile that captures the end-to-end process (from download.R to plot_all.pdf & plot_Amsterdam.pdf). Also, add an all and clean phony target.
Exercise
Swap the url_listings and url_reviews for a historical dataset of Amsterdam from the previous year (gather the links from the "show archived page"). Run make again in the root directory.
Do the same for a recent Airbnb dataset from New York. If done correctly, it should not take more than a minute (power to automation!). Do your workflows still run as expected? How about the plot_Amsterdam.R file? Why is that?